Numerical predictive check
Purpose
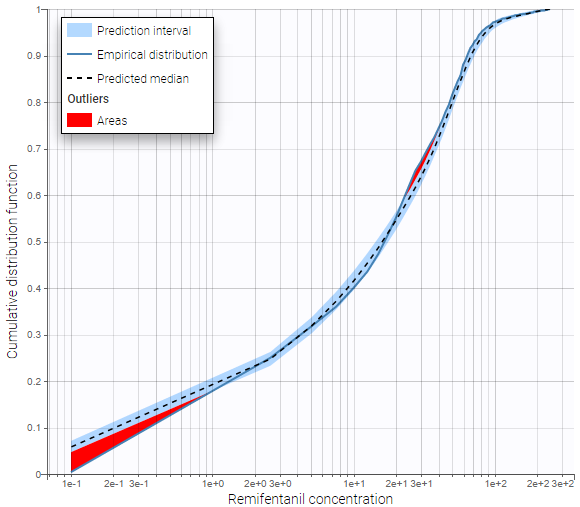
This plot displays the numerical predictive check (NPC). The NPC is a model diagnosis tool for continuous data which is closely related to the VPC procedure: the principle is similar, with a different way to visualize the resulting information. While the VPC maintains the time dimension and can be used to point out at which time points the model overpredicts or underpredicts the data, the NPC allows to compare the empirical cumulative distribution function (CDF) of the observations, computed on the original data set, with the theoretical cumulative distribution, computed from data simulated with the model of interest and the design structure of the original data set.
Note that since the NPC compares each observation with its own simulated distribution, there is no concern of data binning like for the VPC.
Examples
In the following example, the parameters of a two-compartment model with iv infusion and linear elimination are estimated on the remifentanil data set.
One can see the empirical CDF of remifentanil concentration in blue, compared to the theoretical CDF based on simulated data in black. The 90% prediction interval corresponding to the theoretical CDF is visualized as a light blue area. Discrepancies between the empirical CDF and this area are marked in red. The log-scale on the x-axis allows to focus on small observations. The plot shows that the model underpredicts small observations, and tends to overpredict some observations between 20 and 40 units.

Settings
General: Add/remove legend or grid.
Display
Empirical distribution: Add/remove empirical CDF.
Predicted median: Add/remove theoretical CDF.
Prediction interval: Add/remove the prediction interval for the theoretical CDF, and set the interpercentile level for the prediction interval (by default the level is 90) and its associated level.
Outliers (area): Add/remove red areas indicating where the empirical CDF is outside the prediction interval.
Calculations:
Set the number of evaluation points in the NPC.
Use BLQ: Choose to use BLQ data or to ignore it to compute the VPC. BLQ data can be simulated, or can be equal to the limit of quantification (LOQ). The latter case induces strong bias.
