
The panel on top shows a table overview of the Monolix runs selected in the Selection panel, that has the following functions, detailed on this page:
-
Displaying key information on each Monolix run
-
Elements from the projects: project name, structural morel, error model, covariates, correlation groups, comments
-
Objective function and BICc from the results
-
-
Performing actions on each run
-
Running one or several projects in Monolix
-
Opening a project in Monolix or opening its result folder
-
Cloning a project
-
Updating the elements and results of a run
-
-
Modifying elements of the Sycomore overview
-
Including projects as nodes in the tree view
-
Changes from parent nodes
-
Selecting projects for side-by-side comparison
-
Removing a run from the table
-
Rating
-
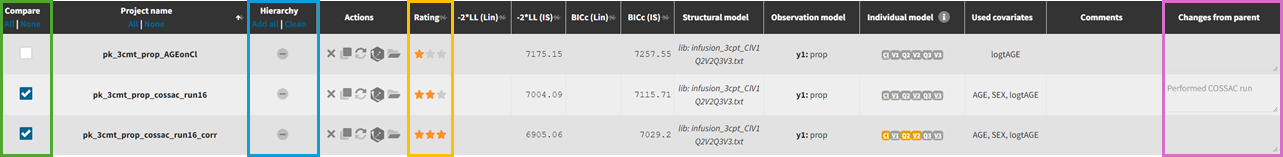
An example is shown below:
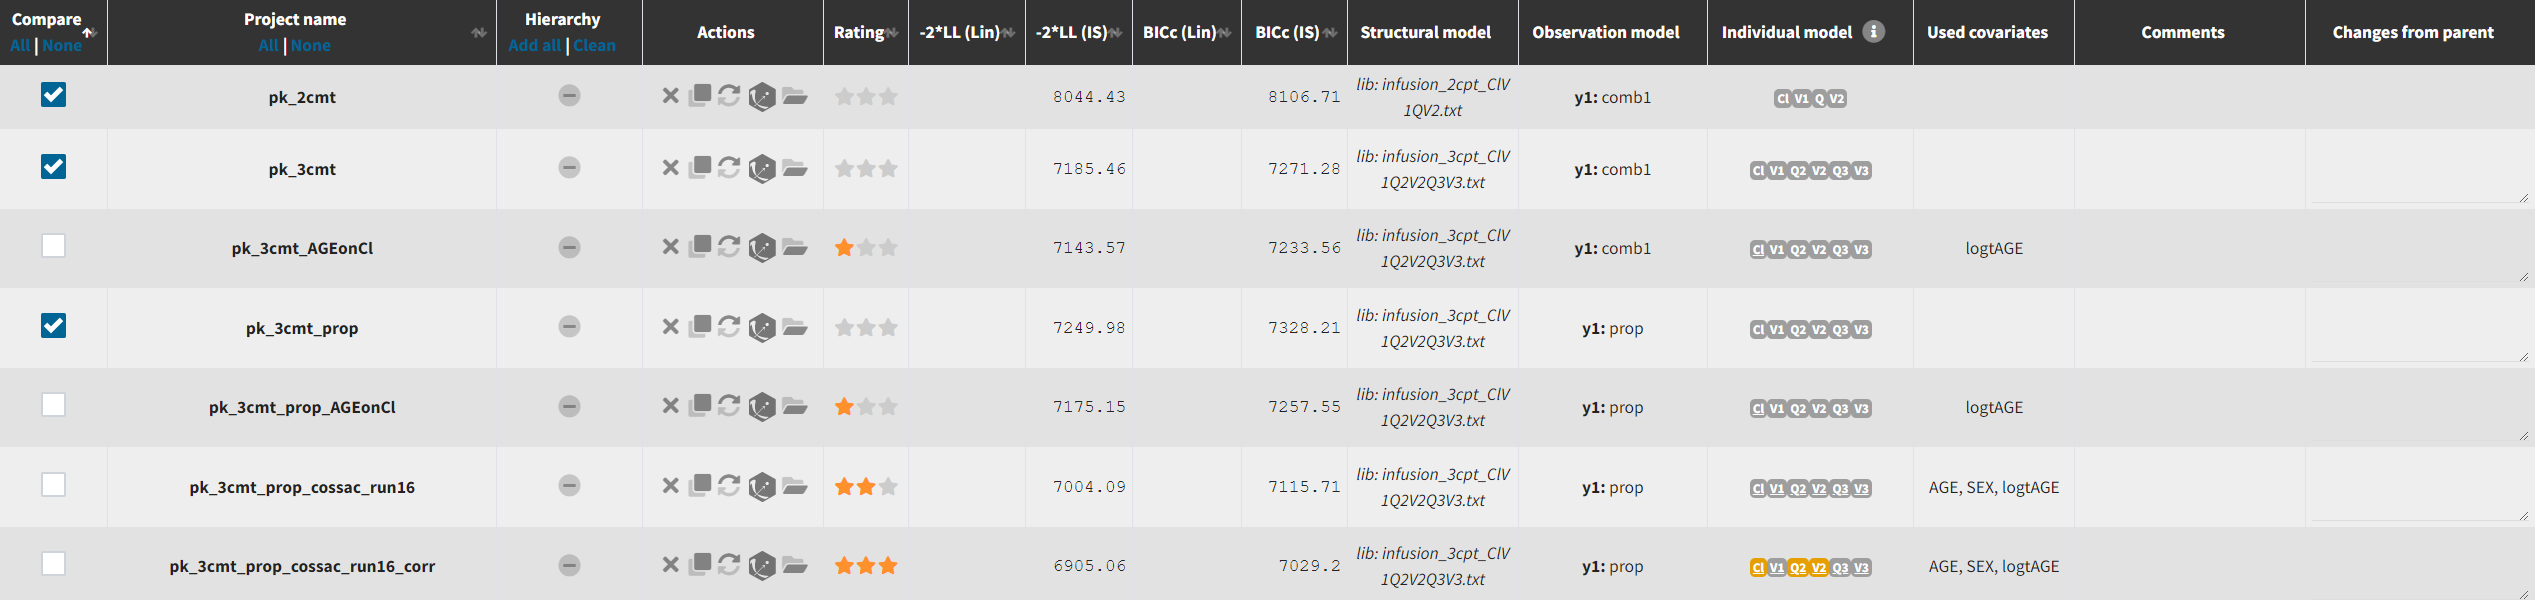
Displaying key information on each Monolix run
Project settings
The name of the projects displayed in the table are the file names without the .mlxtran extension. If several projects from different folders have the same name, the name of the folders are also added to distinguish them. It is possible to sort the table rows by project name.
The main elements of the structural and statistical models from each Monolix projects are displayed in the columns:
-
Structural model: the path to the structural model
-
Observation model: the error model chosen for each observation id (const=constant, prop=proportional, comb1=combined1, comb2=combined2)
-
Individual model: the names of the parameters are displayed. They are underlined if they are involved in covariate effects, in italic if they have no variability, and colored if they are part of correlation groups.
-
Used covariates: covariates that are used in the statistical model.
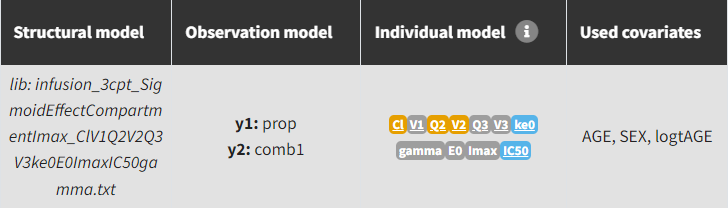
An example if shown below, where the structural model is the file infusion_3cpt_SigmoidEffectCompartmentImax_ClV1Q2V2Q3V3ke0E0ImaxIC50gamma.txt from the PKPD models library, the error model is proportional (PK) and combined 1 (PD), the individual parameters Cl, V1, Q2, V2, Q3, V3, ke0, gamma, E0, Imax and IC50 all have random effects are all have some covariate effect, among the covariates AGE, SEX, logtAGE. There are also two correlation groups: {Cl, Q2, V2} and {ke0, IC50}.
The column Comments displays all comments saved in the Monolix projects. Note that markup or markdown formatting is not applied.
Objective function and BIC
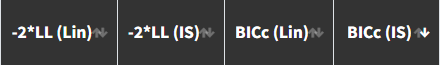
The log-likelihood and corrected BIC are displayed in the columns:
-
-2*LL (Lin): -2*log-likelihood computed by linearization,
-
-2*LL (IS): -2*log-likelihood computed by importance sampling,
-
BICc (Lin): corrected BIC based on the log-likelihood computed by linearization,
-
BICc (IS): corrected BIC based on the log-likelihood computed by importance sampling.
Table rows can be sorted in increasing or decreasing order according to each of these columns with the sorting icon, as seen here:
Performing actions on each run
Running one or several projects in Monolix
The table can be used to select projects in a run list that can be run together in a row. This is done by clicking on each project name, as can be seen below. A button “Run” appears, it runs the scenario defined in each project. The results are then automatically updated in the table.
Action buttons
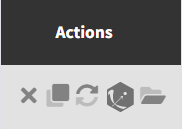
The column named Actions contains a set of buttons, seen above, to perform useful actions. Their functions are:
-

-

-

-

-

Modifying elements of the Sycomore overview
Several elements of the table can be modified and saved in the Sycomore project.
-
Selecting projects for side-by-side comparison (see green mark above): this is done by checking bowes in the column named “Compare”. The selected projects are then displayed in the Comparison tab.
-
Including projects as nodes in the tree view (see blue mark above): with buttons in the column named “Hierarchy”.
-
Rating (see orange mark above): by clicking on the stars in the column Rating. The ratings then appear as a color code in the tree view (*: red, **: orange, ***: red).
-
Changes from parent nodes (see purple mark above): text fields for projects that have a parent in the tree diagram can be filled directly in the column named “Changes from parent”, or in the tree diagram.