PSA and survival data set
Download data set: PSA_survival_dataset.csv
This data set has been originally published in:
It contains PSA kinetics and survival data for 400 men with metastatic Castration-Resistant Prostate Cancer (mCRPC) treated with docetaxel and prednisone, the first-line reference chemotherapy, which constituted the control arm of a phase 3 clinical trial. In this context of advanced disease, the incidence of death is high and the PSA kinetics is closely monitored after treatment initiation to rapidly detect a breakthrough in PSA and propose rescue strategies. In more details:
PSA kinetics: 6627 PSA measurements were collected, among which roughly 20% were pretreatment, 60% on treatment, and 20%posttreatment. 2.5% are below the limit of quantification (LoQ),set at 0.1 ng.ml−1.
survival: 286 patients deceased (71.5%), leading to a median survival of 656 days.
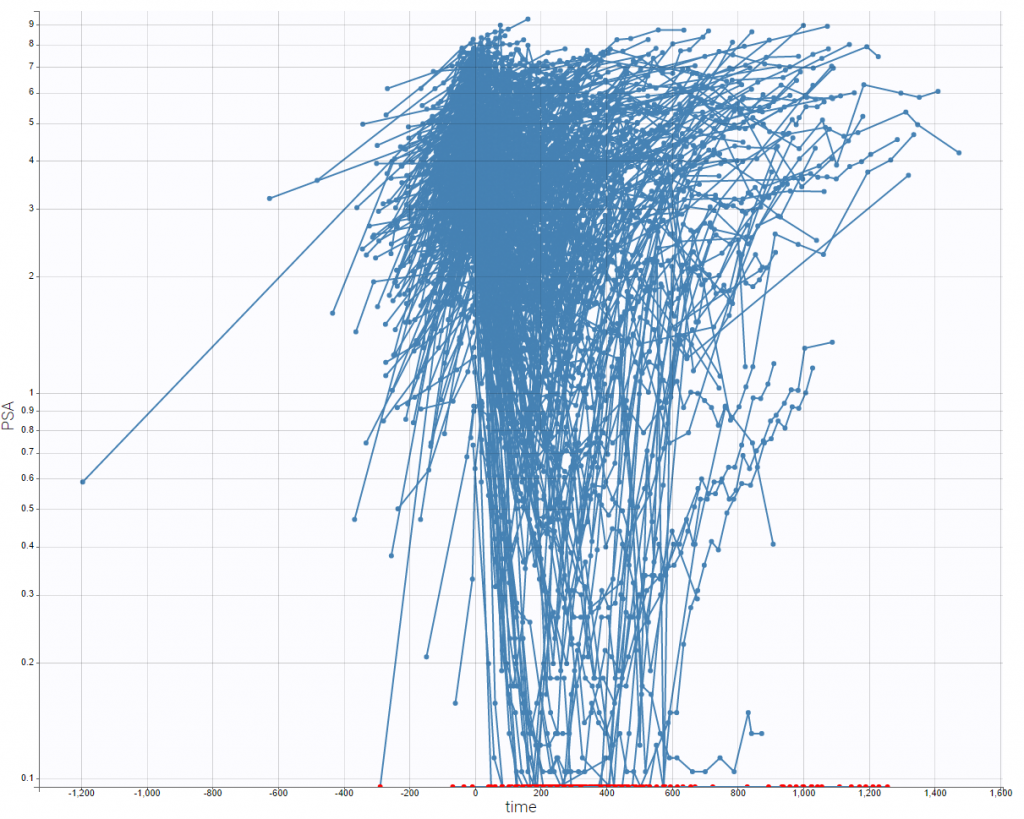
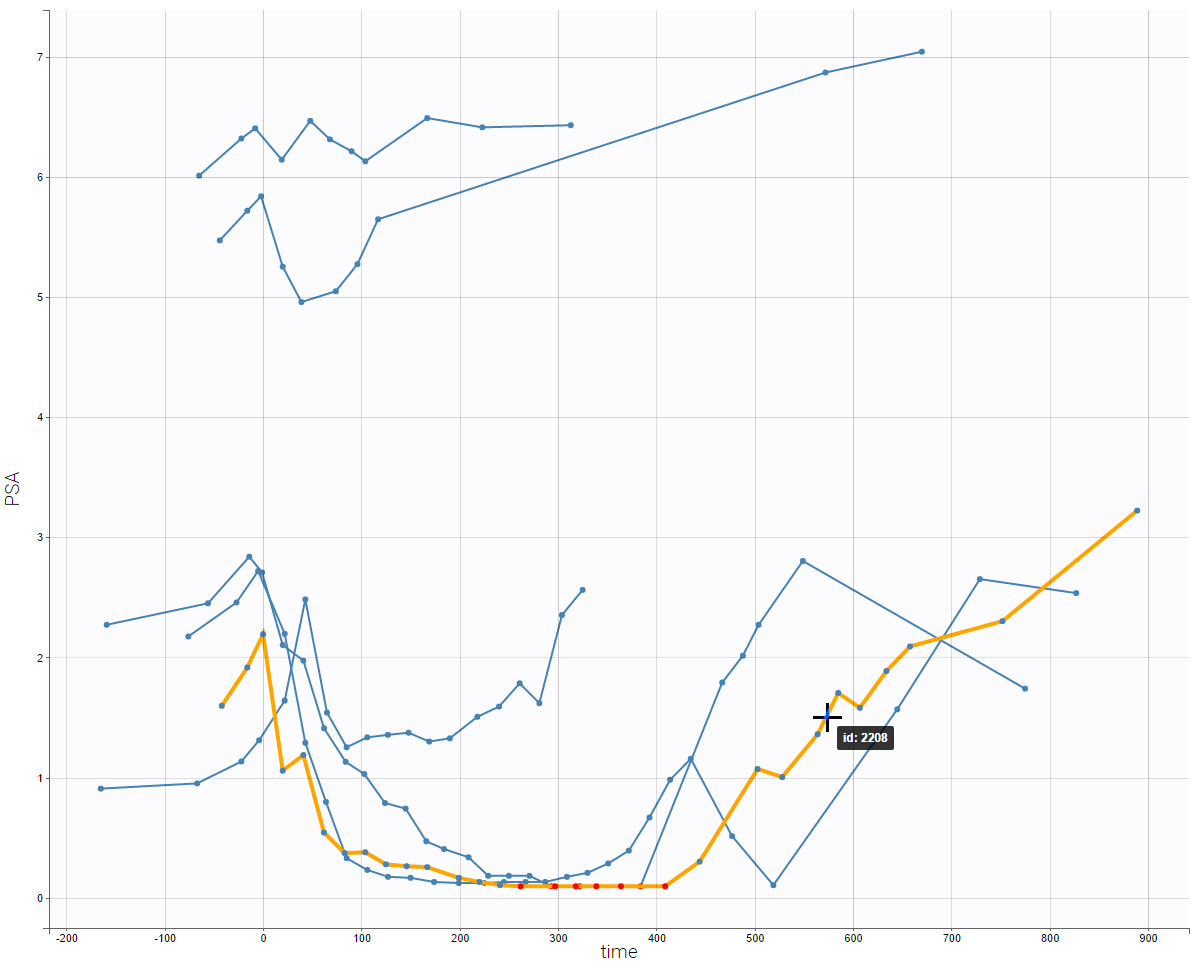
PSA measurements are displayed on the figure below. Since the data density is too high to see clearly, the next figure is a selection of six individuals, that allows to identify the shape of PSA measurements followed by most individuals: a decrease of PSA concentration after the treatment initiation at time zero, followed by an increase some time later due to resistance.


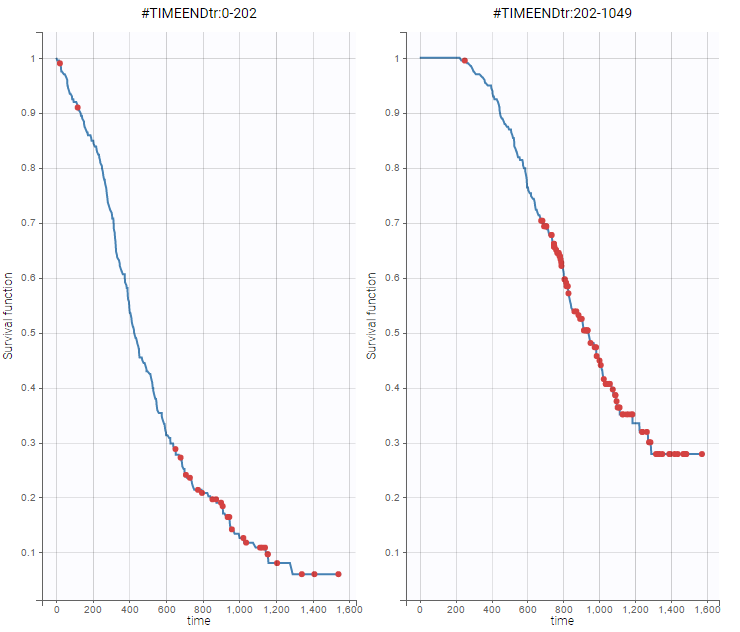
The following figure shows the Kaplan-Meier curves for the survival data split in two groups by the median time of end of treatment

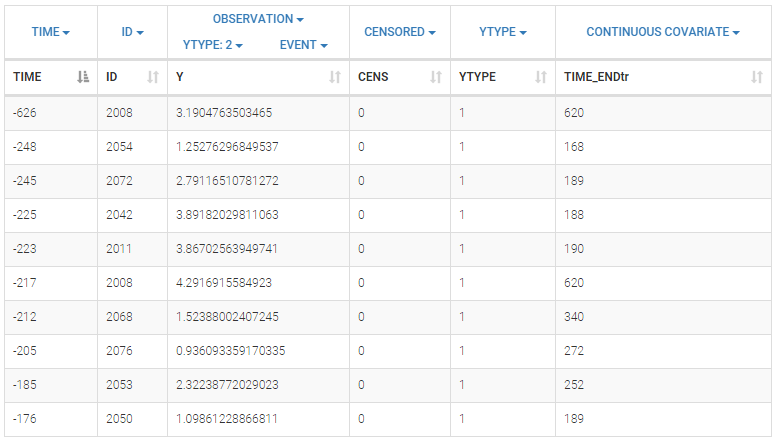
Below is an extract of the data set file:

The columns are:
TIME: the time of the measurement or of the dose, column-type TIME.
ID: the subject ID, column-type ID.
Y: measurements of PSA concentration in ng.ml−1, or death events, column-type OBSERVATION.
CENS: CENS=1 indicates values below the limit of quantification (LoQ), column-type CENSORING.
YTYPE: the type of measurement. There are two measurement types in this data set: the PSA concentration measurement (corresponding to the PD), and death events, column-type OBSERVATION ID.
TIME_ENDtr: day of end of treatment, column-type CONTINUOUS COVARIATE.
