Specifying observation types and regressor settings
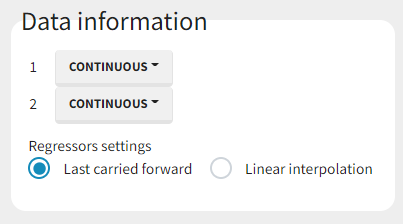
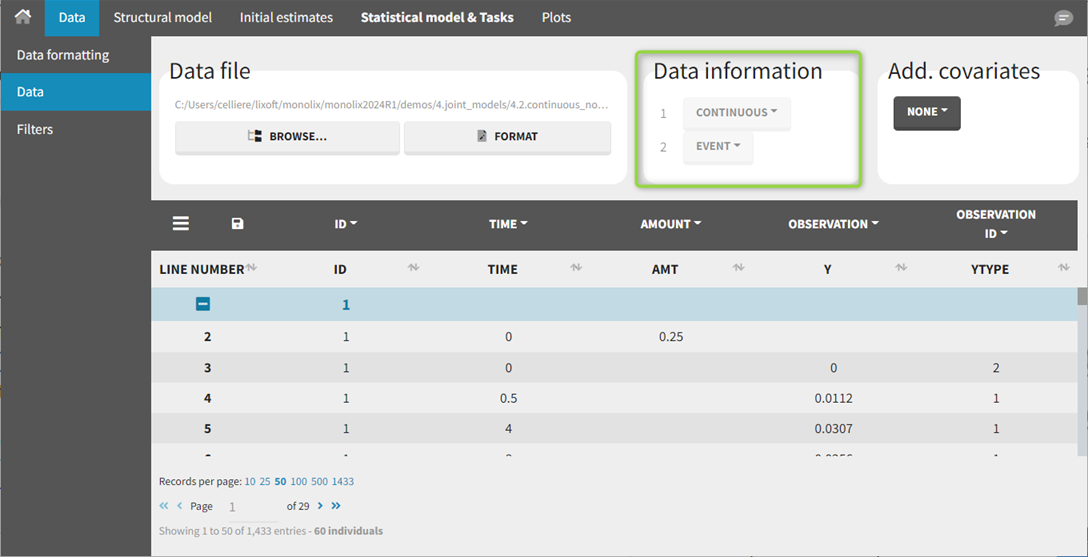
During and after the data tagging procedure, the Data information section is available in the Data tab.

The Data information section contains:
dropdown(s) for definition of observation types,
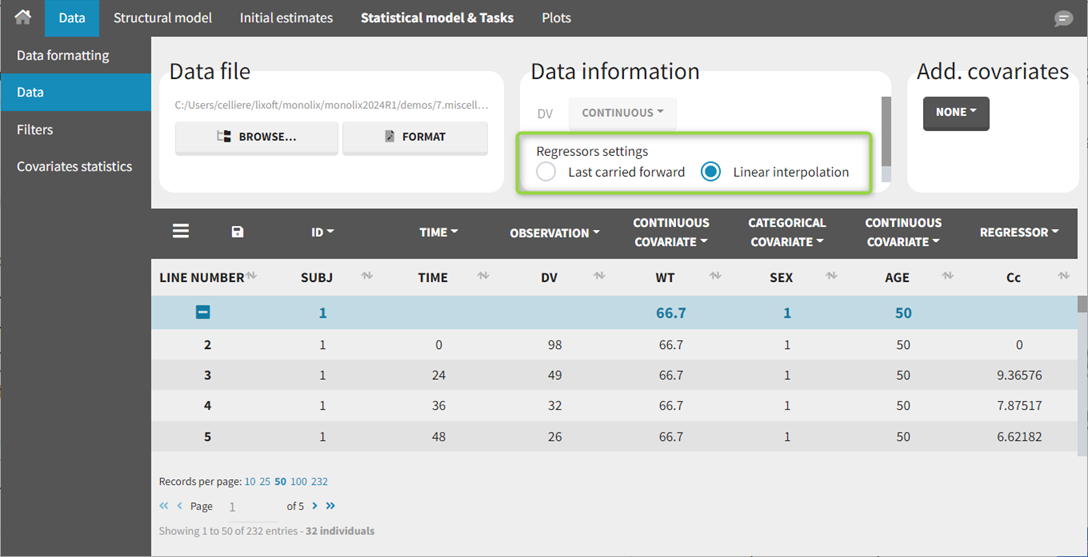
regressor settings (if at least one of the columns was tagged as a regressor column).
Observation types
There are three possible types of observations in Monolix:
continuous: The observation is continuous and can take any value within a range. For example, a concentration is a continuous observation.
count/categorical: The observation values can take values only in a finite categorical space. For example, the observation can be a categorical observation (an effect can be observed as “low”, “medium”, or “high”) or a count observation over a defined time (the number of epileptic crisis in a week).
event: The observation is an event, for example the time of death.
For each OBSERVATION ID, the type of observations must be specified by the user in the interface. Depending on the choice, the data will be displayed in the Observed Data plot in different ways (e.g spaghetti plot for continuous data and Kaplan-Meier plot for event data). The mapping of model outputs and observations from the dataset will also take into account the data type (e.g a model outptu of type “event” can only be mapped to an observation that is also an “event”). Once a model has been selected, the choice of the data types are locked (because they are enforced by the model output type).

Regressor settings
If columns have been tagged as REGRESSORS, the interpolation method for the regressors can be chosen.
Regressors are defined over time for a finite number of time points. In between those time points, the regressor value can be interpolated in two different ways:
last value carried forward: if we have defined
at time
and
at time
for
,
[first defined value is used]
for
,
[previous value is used]
for
,
[previous value is used]
linear interpolation:
for
,
[first defined value is used]
for
,
[linear interpolation is used]
for
,
[previous value is used]
The interpolation is used to obtain the regressor value at times not defined in the dataset. This is necessary to integrate ODE-based models (which are using an internal adaptative time step), or obtain prediction on a fine grid for the plots (e.g in the Individuals fits) for instance.
When some dataset lines have a missing regressor value (dot “.”), the same interpolation method is used.

