Data exploration
Once the dataset has been tagged and accepted:
-
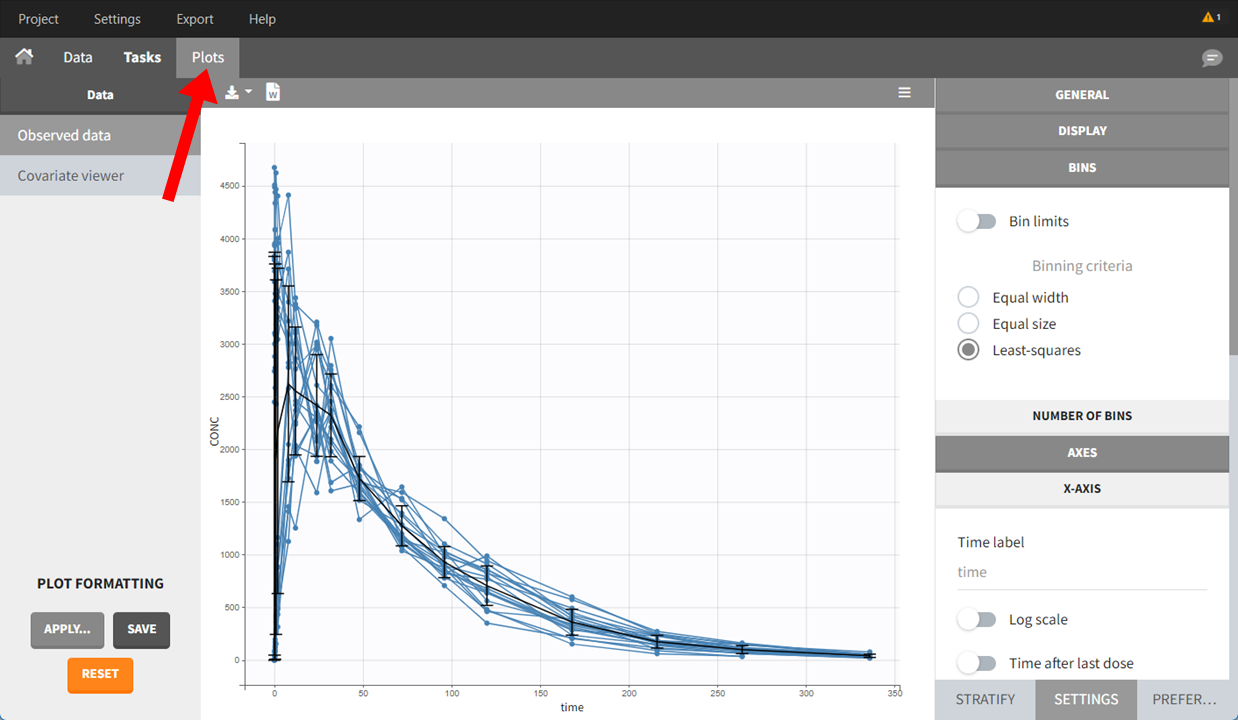
Plots are automatically generated based on the interpreted dataset to help you explore the data before running any of the tasks.
-
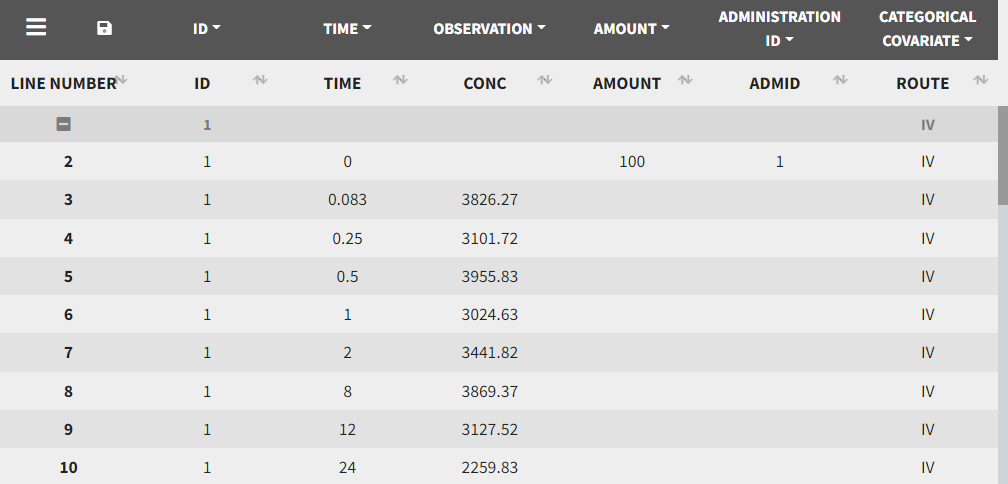
The interpreted dataset appears in Data tab, which shows the final dataset after formatting, setting units, and filtering.
-
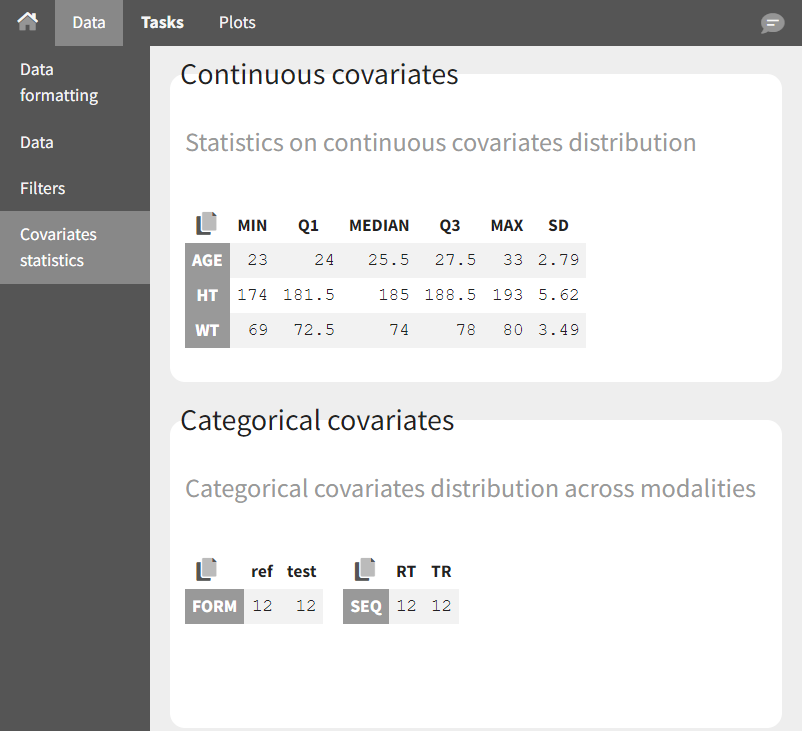
Covariate Statistics appear in a section of the data tab.