Beta regression model
Beta regression models have been recommended for bounded outcome scores that take values on a finite interval. Examples of bounded outcome data are the cognitive component of the Alzheimer’s disease assessment scale (ADAS-cog), a key measure of cognition in Alzheimer’s disease patients, which takes integer values from 0 to 70.
As the data is bounded within a certain range, the standard deviation of the error must approach zero as the model prediction approaches the boundary. If the data is considered as continuous, this can be achieved by considering a logitnormal distribution in the error model definition. However, this does not allow to use beta densities which are commonly used for scores.
To demonstrate the implementation of beta regression models in Monolix, we will use the dataset simulated in the following Nonmem tutorial:
In order to handle data at the boundary, we will adapt the model to use an augmented beta distribution with inflation at boundaries, as described in the following presentation:
Rogers, Jim & French, Jonathan. An Extension of Beta Regression to Handle Scores at Boundaries.
Case study model
We are considering a model for the progression over time of Alzheimer’s disease, measured by the ADAS-cog scale, which are integers from 0 to 70.
In Nonmem, the scores are normalized to obtain a response variable between 0 and 1. The probability to observe the value
is described by a beta density:
|
|
with the mean of the response process and
the precision parameter (error parameter).
With the above probability density, the probability to have an observation on the boundary (being 0 or 1) is null, i.e and
. In order to handle observations at the boundary, we will rather use an augmented beta distribution with an inflated probability for boundaries values:
|
|
The probability of observing zeros depends on the mean response (as the probability to observe low non-zero counts does). The following choice for
and
achieves good properties:
|
|
The mean of the response must stay between 0 and 1 so it is convenient to use a logit link function to define it. In addition, the model should capture how
evolves over time, which corresponds to the disease progression. It this example we assume a simple linear evolution.
|
|
with the intercept and
the slope of the evolution over time.
General idea
In opposition to Nonmem, the data will be considered as count/categorical In Monolix. This allows (1) to take into account that the scale can take only integer values and (2) to define the likelihood instead of the model prediction. The probability density function will be straighforward to write using the build-in gammaln() function of the mlxtran language.
Dataset formatting
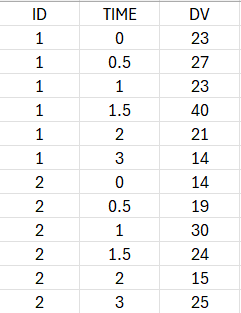
The OBSERVATION column of the dataset should contain the integer scores (and not a derived response variable between 0 and 1).

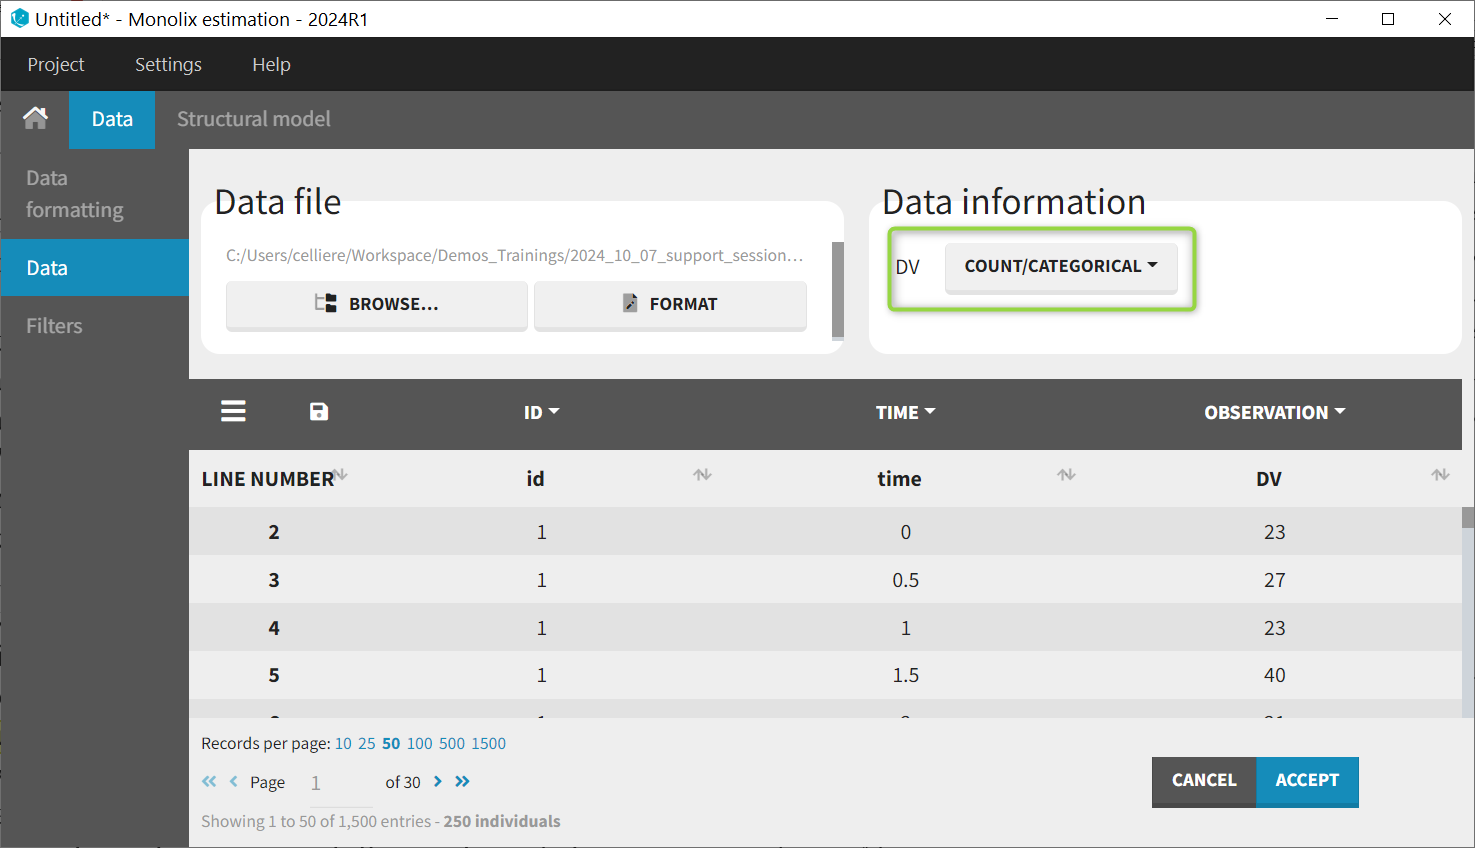
When loading the dataset, the observations must be indicated as being of type COUNT/CATEGORICAL:

Structural model
The DEFINITION block is used to define the model output to be a random variable following a beta probability density function. Note that in Monolix represents the scores from 0 to 70. An if/else statement is used to distinguish the case
yij=0, yij=70 and otherwise. The normalized variable (between 0 and 1) is calculated directly in the equation using yij/maxValue with maxValue=70.
We define the exponential of the log of the probability in order to transform the product into a sum and avoid divisions of large numbers. This also allows to use the gammaln() function representing the log of the gamma function.
DEFINITION:

ADAScog = {type=count,
if yij==0
   pk = p0
elseif yij==maxValue
   pk = p1
else
   pk = (1-p0-p1) * exp(gammaln(tau)-gammaln(mu*tau)-gammaln((1-mu)*tau) + (mu*tau-1)*log(yij/maxValue) + ((1-mu)*tau-1)*log(1-yij/maxValue) - log(maxValue))
end
P(ADAScog=yij)= pk }
The time evolution of and the definition of
and
are defined in the EQUATION block (above the DEFINITION block):
[LONGITUDINAL]
input={tau, B0, B1, gamma0, gamma1}

EQUATION:
LINP = B0 + B1 * t
mu = exp(LINP)/(1+exp(LINP))

maxValue = 70

lp0 = -gamma0-gamma1*log(mu/(1-mu))
lp1 = -gamma0+gamma1*log(mu/(1-mu))
p0 = exp(lp0)/(1+exp(lp0))
p1 = exp(lp1)/(1+exp(lp1))
Statistical model
The distribution of the observations has already been defined in the structural model file, so there is nothing to do regarding the residual error model.
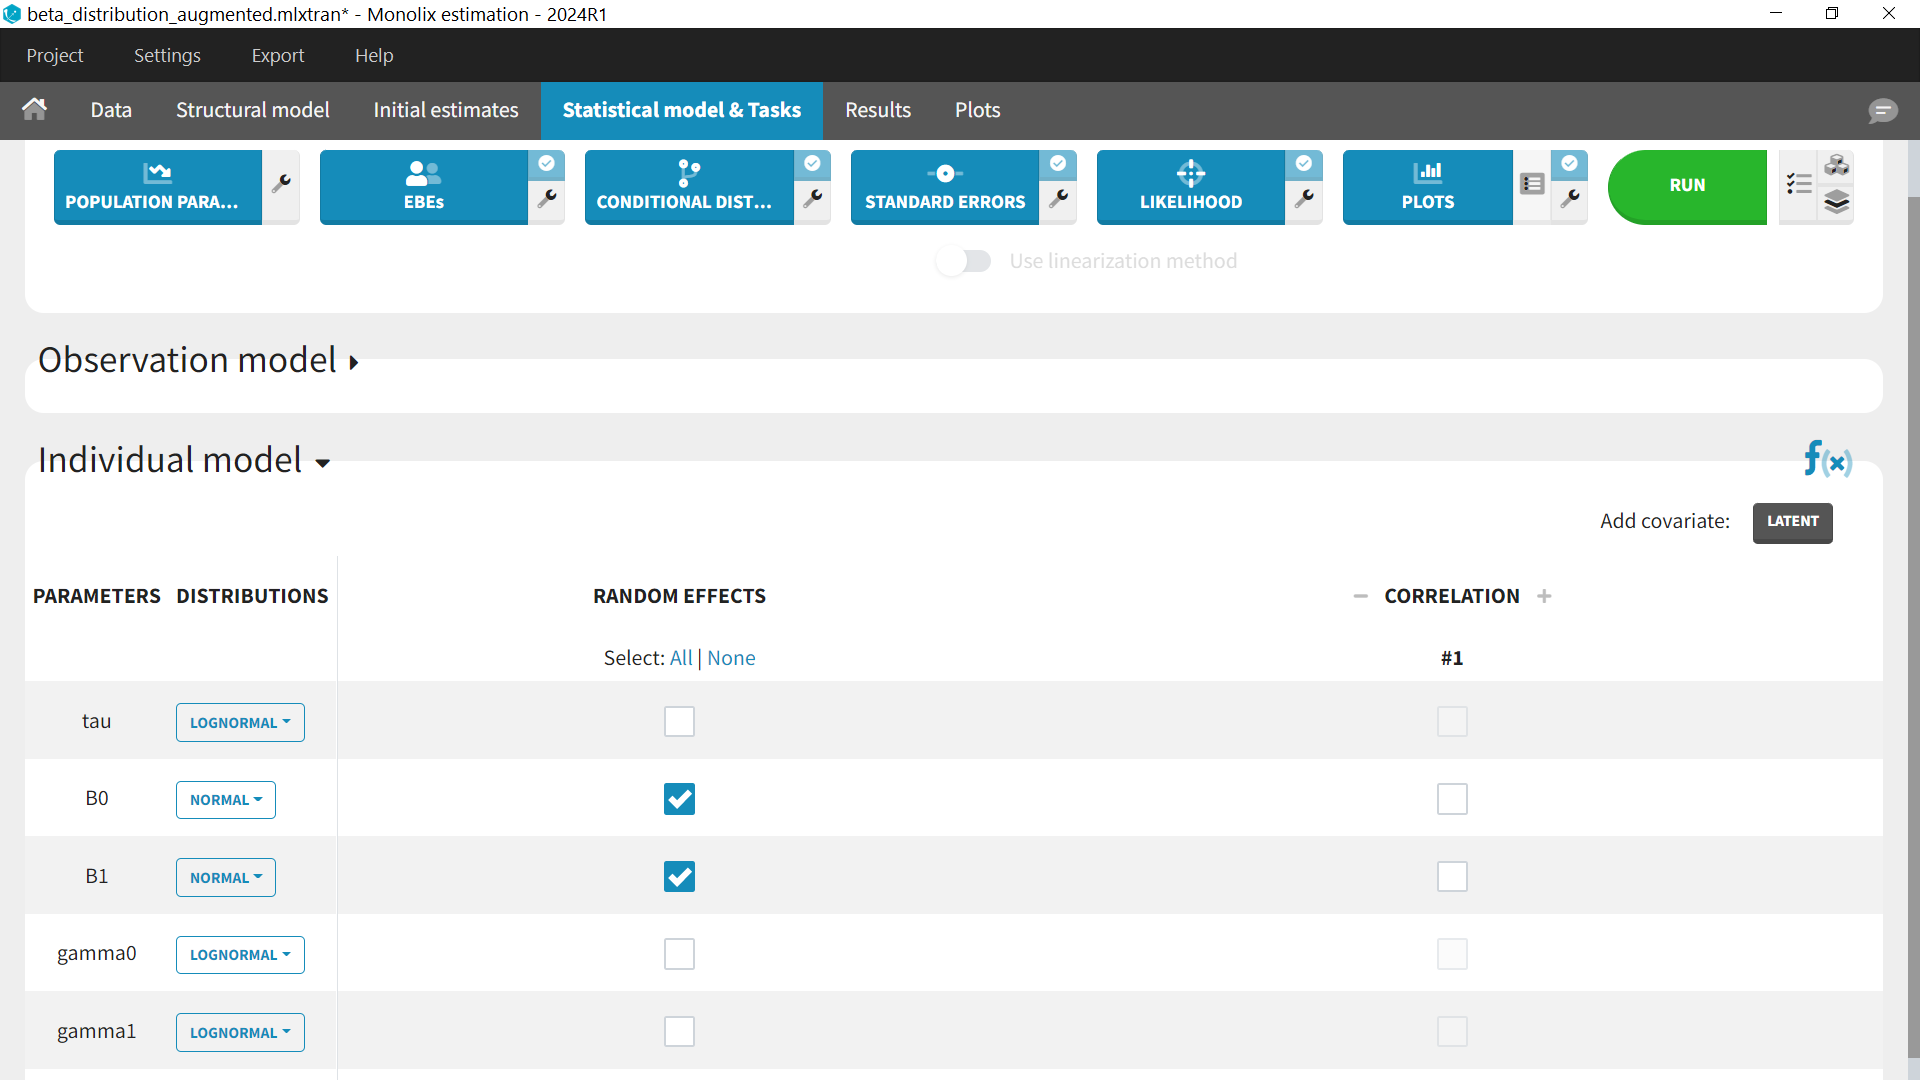
For the parameter distributions, we use a normal distribution with IIV for B0 (intercept) and B1 (slope). The other parameters (tau, gamma0 and gamma1) have no IIV. They are positive so we can keep a lognormal distribution.

Diagnostic plots
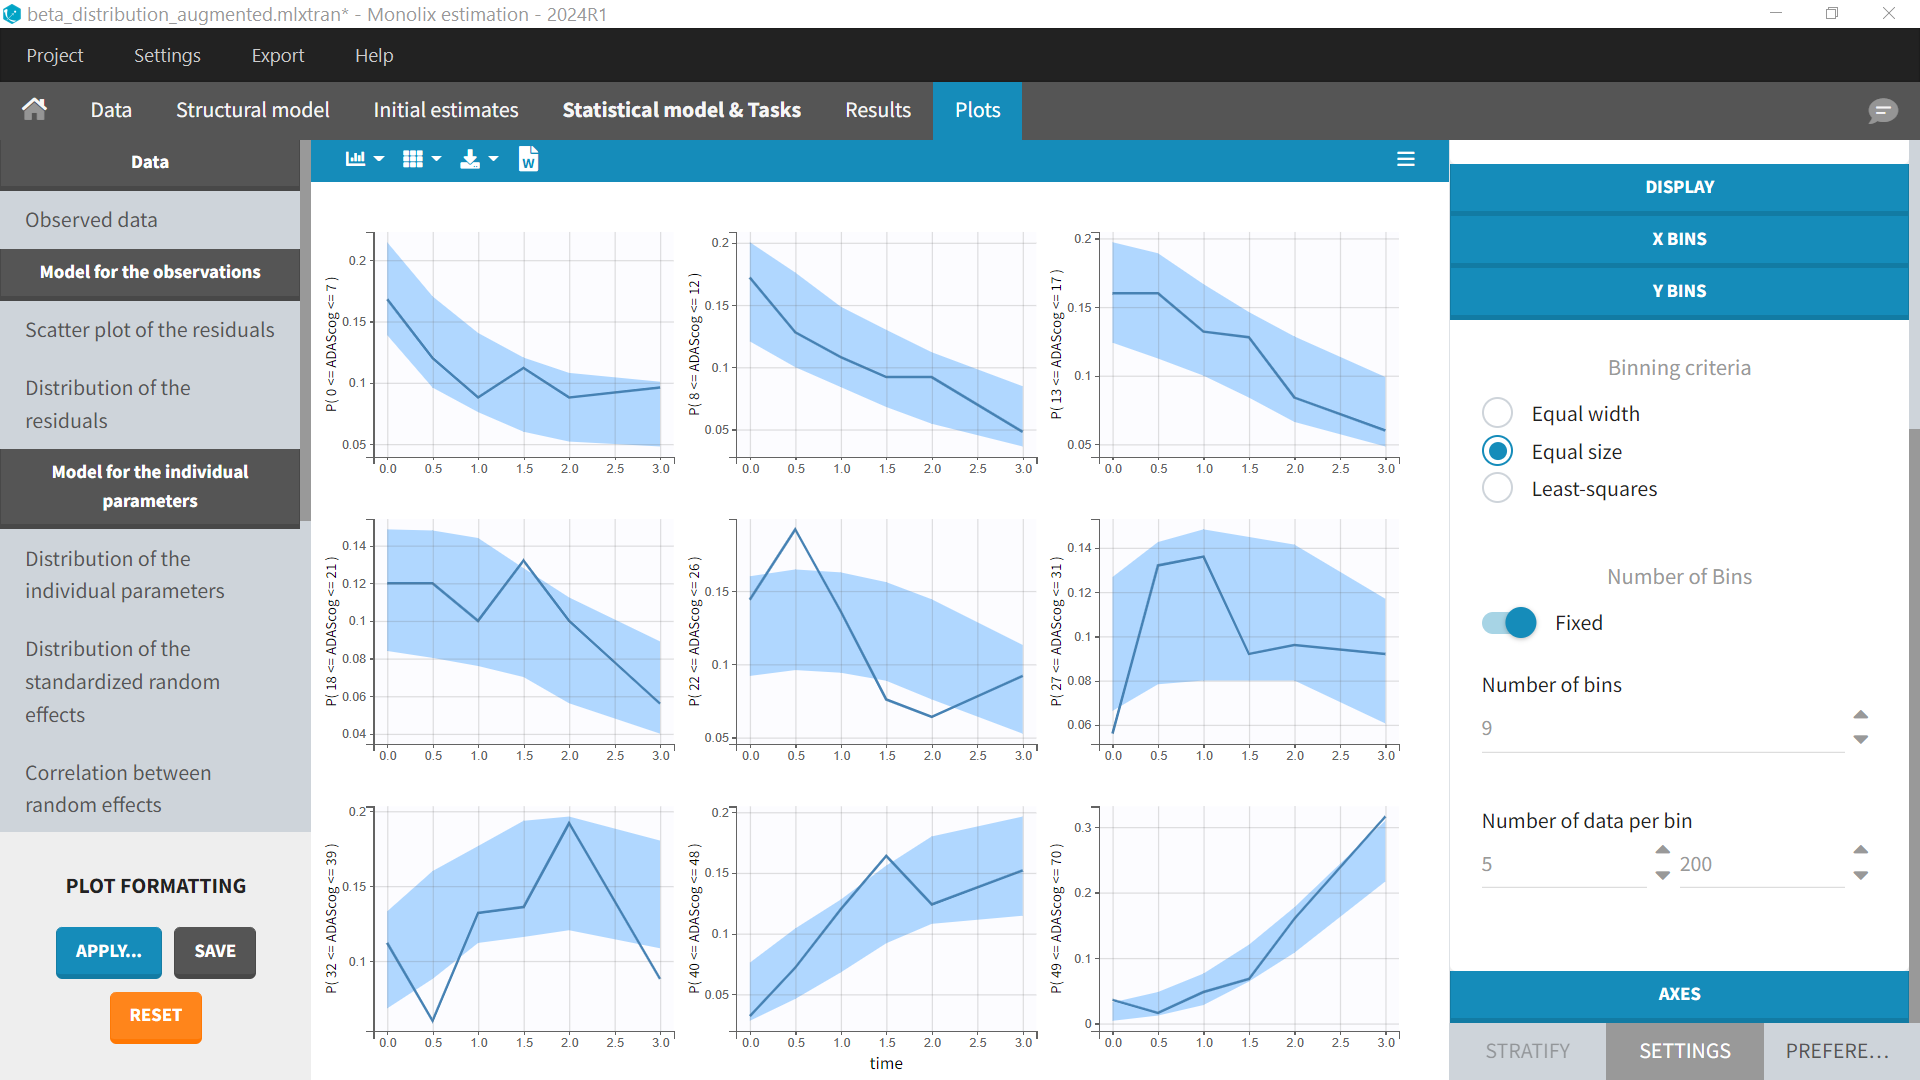
The diagnostic plots will be those corresponding to count data. There is no individual fits and the VPC shows the probability of the score to be within a range (corresponding to the Y Bins settings):

Case study download
The entire case study using simulated data can be downloaded below. It must be open with version 2024 or above. Download link.
