The following page describes all the settings that can be used in table placeholders in reporting templates. Placeholders for tables can include four different groups of settings. These are:
-
“data” (required) – containing settings about table content, such as type of the table, and rows and columns that the table will contain,
-
“display” (optional) – containing information about table display (e.g., number of significant digits to which the values in the table should be rounded, table direction, style, …),
-
“renamings” (optional) – containing various words present in the data set or Monolix that should be reworded in the table.
Settings inside these groups of settings need to be indented or put inside curly brackets. It is crucial to respect the indentation rules and the space after the “:” for the placeholder to be properly interpreted.
Data
Data settings define the type of the table that will be generated, as well as rows and columns that the table will contain. Here is the list of all settings of the data group of settings, along with their descriptions:
|
Setting |
Table |
Required
|
Possible values |
Description |
|
task |
All |
yes |
populationParameters, individualParameters, correlationMatrix, likelihood |
Task of which the table represents the results. |
|
table |
Likelihood and SE tables |
no |
Likelihood: criteria/samplingInformation
|
Table type. If empty, criteria or matrix table will be generated, depending on the task. |
|
methods |
Population parameters and likelihood |
no (default: all) |
Population parameters: linearization, stochasticApproximation, all
|
Value for population parameters is used for the SE part of the table. |
|
method |
Individual parameters and SE |
yes |
Individual parameters: mode, mean
|
Method for reported values. |
|
metrics |
Population parameters table |
no |
SE, RSE, CV, SHRINKAGE, all |
If equal to “all”, all available rows or columns will be present in the table. If specific metrics are given, only those rows/columns will be available in the table. |
|
metrics |
Individual parameters table |
no |
ID, MIN, Q1, MEDIAN, Q3, MAX, SHRINKAGE, all |
If equal to “all”, all available rows or columns will be present in the table. If specific metrics are given, only those rows/columns will be available in the table. |
|
metrics |
SE tables |
no |
Matrix table: RSE
|
If equal to “all”, all available rows or columns will be present in the table. If specific metrics are given, only those rows/columns will be available in the table. |
|
metrics |
Likelihood tables |
no |
Criteria table: OFV, AIC, BIC, BICc, all |
If equal to “all”, all available rows or columns will be present in the table. If specific metrics are given, only those rows/columns will be available in the table. |
|
excludedMetrics |
All |
no (default: none) |
Same arguments as for metrics (except “all”). |
Metrics that will be excluded from the table. Handy when a user wants to specify metrics: “all” and exclude a few with excludedMetrics. |
|
parameters |
All except SE tables |
no (default: all) |
Model parameter names, or all. |
Parameters that will be included in the table. |
|
excludedParameters |
All except SE tables |
no (default: none) |
Model parameter names, or all. |
Parameters that will be excluded from the table. |
|
ids |
Individual parameters |
no (default: all) |
One or several of IDs present in the dataset, or “all”. |
IDs of subjects whose parameters should be shown in the table. The summary statistics will be calculated on all individuals, not just ones shown in the table. If not present, default is “all”. |
|
excludedIds |
Individual parameters |
no (default: none) |
Same arguments as for ids, excluding “all”. |
IDs of subjects whose parameters should be excluded from the table. The summary statistics will be calculated on all individuals, not just ones shown in the table. |
|
nbOccDisplayed |
Individual parameters |
no (default: -1 meaning all) |
-1 or an integer |
-1 means all occasion levels are diplayed. 0 mean none of the occasion levels are diplayed. 1 means only the first occasion level is displayed, etc. |
|
covariates |
Individual parameters |
no (default: all) |
One or more of covariates present in the data set, or “all”. |
Which covariates to include in the table. |
|
covariatesAfterParameters |
Individual parameters |
no (default: true) |
true, false |
If covariates should be shown after parameters in the table. |
|
types |
Population parameters table |
no (default: all) |
One or more of: fixedEffects, stDev, correlations, error, all |
Which types of parameters should be included in the table (fixed effects, standard deviations of random effects, correlations, error model parameters). |
Display
Display group of settings defines how the information in the tables will be displayed. Here is the list of all settings for the display group of settings:
|
Setting |
Table |
Required |
Possible values |
Description |
Example(s) |
|
style |
All |
no (default: selected in Generate report pop-up) |
Name of table styles present in the template document. |
Microsoft Word document template style to apply to the table. This setting overrides the setting in the Generate report pop-up. |
style: “Medium Grid 1 – Accent 1” |
|
metricsDirection |
All |
no (default: vertical) |
vertical, horizontal |
Direction of metrics. |
metricsDirection: horizontal |
|
significantDigits |
All |
no (default: taken from Preferences) |
positive integers |
Number of significant digits values in the table will be rounded to. |
signifcantDigits: 3 |
|
trailingZeros |
All |
no (default: taken from Preferences) |
true, false |
If trailing zeros should be shown in the tables. |
trailingZeros: true |
|
fitToContent |
All |
no (default: true) |
true, false |
If true, width of the table will be equal to the width of content, otherwise width of the table will be equal to the width of the page. |
fitToContent: false |
|
caption |
All |
no (default: no caption) |
a phrase inside quotation marks |
Caption that will appear next to the table. |
caption: “EBEs” |
|
captionAbove |
All |
no (default: false) |
true, false |
If true, caption will be positioned above the table. If false, caption will be positioned below the table. |
captionAbove: true |
|
fontSize |
All |
no (default: 12) |
a number |
Font size of the table content (will not be applied to the caption). |
fontSize: 10 |
|
colored |
SE matrix table |
no (default: true) |
true, false |
If values should be color-coded. |
colored: false |
Renamings
Renamings setting can be provided to the placeholder to replace certain words or expressions that will appear in the table with a user-defined word or expression. We will explain the usage of renamings setting on a concrete example.
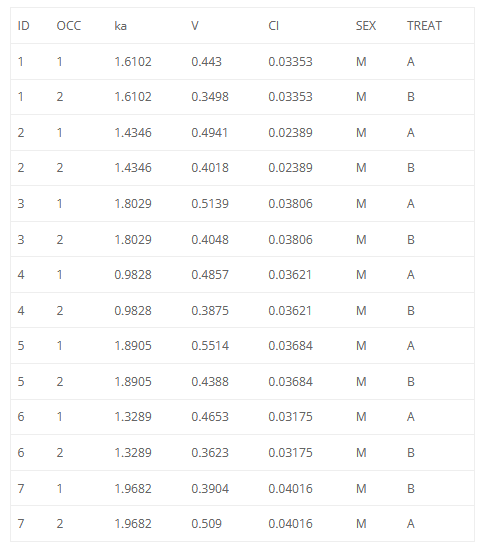
Let’s take a look at the demo project iov1_project.mlxtran. Let’s say we want to put a table of EBEs in the report, with renaming of the occasion column header.
A generated placeholder for the EBEs table, with its default settings, is shown below, including the table it generates.
<lixoftPLH>
data:
    task: individualParameters
    method: mode
    metrics: [ID]
    parameters: all
    covariates: all
    covariatesAfterParameters: true
display:
    significantDigits: 4
    fitToContent: true
    metricsDirection: vertical
</lixoftPLH>
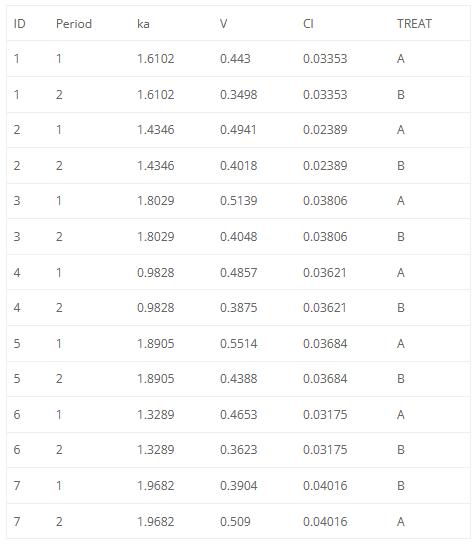
Let’s say we would like to hide some of the columns (SEX) and rename some of the expressions in the table. For example, it would be convenient to rename “OCC” to “Period”. We can then modify the placeholder to look like the one on the left and it will generate the table on the right.
<lixoftPLH>
data:
    task: individualParameters
    method: mode
    metrics: [ID]
    parameters: all
    excludedCovariates: SEX
    covariatesAfterParameters: true
display:
    significantDigits: 4
    fitToContent: true
    metricsDirection: vertical
renamings:
    OCC: "Period"
</lixoftPLH>