Oropharynx data set
Download data set: pharynx_filt.csv
The following data set provides the data for a part of a large clinical trial carried out by the Radiation Therapy Oncology Group in the United States. The full study included patients with squamous carcinoma of 15 sites in the mouth and throat, with 16 participating institutions, though only data on three sites in the oropharynx reported by the six largest institutions are considered here. Patients entering the study were randomly assigned to one of two treatment groups, radiation therapy alone or radiation therapy together with a chemotherapeutic agent. One objective of the study was to compare the two treatment policies with respect to patient survival. Approximately 30% of the survival times are censored owing primarily to patients surviving to the time of analysis. Some patients were lost to follow-up because the patient moved or transferred to an institution not participating in the study, though these cases were relatively rare.
The considered data set comes from The Statistical Analysis of Failure Time Data, by JD Kalbfleisch & RL Prentice, (1980), Published by John Wiley & Sons.
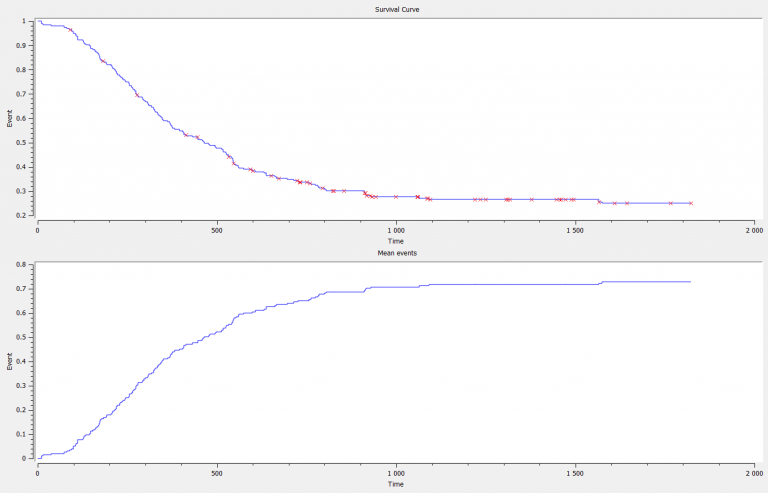
On the following figure, one could see the survival curve and the mean number of events with respect to time.

This study included measurements of many covariates which would be expected to relate to survival experience. Six such variables are given in the data (sex, T staging, N staging, age, general condition, and grade). The site of the primary tumor and possible differences between participating institutions require consideration as well.
CASE          Case Number
INST          Participating Institution
SEX           1=male, 2=female
TX        Treatment: 1=standard, 2=test
GRADE         1=well differentiated, 2=moderately differentiated,
              3=poorly differentiated,  9=missing
AGE           In years at time of diagnosis
COND          Condition: 1=no disability, 2=restricted work, 3=requires assistance
              with self care, 4=bed confined,  9=missing
SITE          1=faucial arch, 2=tonsillar fossa, 3=posterior pillar,
              4=pharyngeal tongue, 5=posterior wall
T_STAGE       1=primary tumor measuring 2 cm or less in largest diameter,
              2=primary tumor measuring 2 cm to 4 cm in largest diameter with
              minimal infiltration in depth, 3=primary tumor measuring more
              than 4 cm, 4=massive invasive tumor
N_STAGE       0=no clinical evidence of node metastases, 1=single positive
              node 3 cm or less in diameter, not fixed, 2=single positive
              node more than 3 cm in diameter, not fixed, 3=multiple
              positive nodes or fixed positive nodes
ENTRY_DT      Date of study entry: Day of year and year, dddyy
STATUS        0=censored,  1=dead
TIME          Survival time in days from day of diagnosis
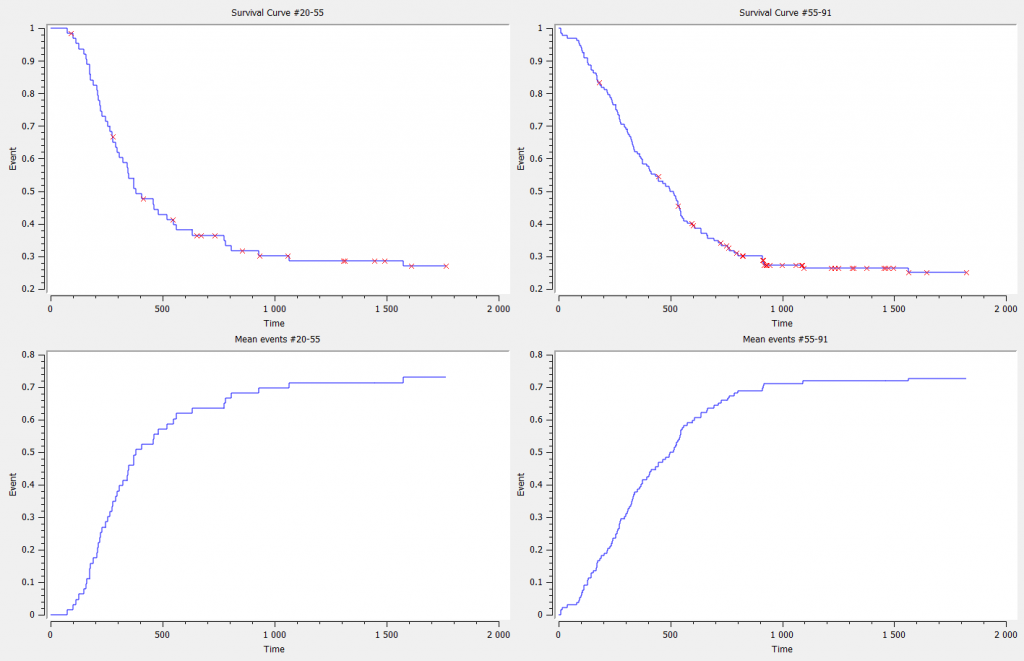
On the two following figure, one could see the survival curve and the mean number of events with respect to time for two groups, the first groups concerns the subjects younger than 55 years and the other group concerns the other one.

Simplified Oropharynx data set
The data set for subjects 47 and 48 can be defined as follows
ID;INST;SEX;TRT;GRADE;AGE;COND;SITE;T_STAGE;N_STAGE;ENTRY_DT;Y;Time
47;4;1;2;2;49;3;1;4;3;5669;0;0
47;4;1;2;2;49;3;1;4;3;5669;1;74
48;3;1;1;1;44;1;1;3;1;2769;0;0
48;3;1;1;1;44;1;1;3;1;2769;0;1609
One must indicated the start time of the observation period with Y=0 (at line 1 and 3 for subject 47 and 48 respectively), and the time of event (Y=1) or the time of the end of the observation period if no event has occurred (Y=0). In this simplified data set, subject 47 had an event at time 74 leading to a line in the data set where Y=1. On the contrary, no event occurred for subject 48. Thus, at the end of the observation (TIME=1609), Y is set to 0.
