Download data set: veteran.csv
In a study conducted by the US Veterans Administration, male patients with advanced inoperable lung cancer were given either a standard therapy or a test chemotherapy. Time to death was recorded for 137 patients, while 9 left the study before death. Various covariates were also documented for each patient.
The primary goal of the study was to assess if the test chemotherapy is beneficial. Secondary goals included the analysis of covariates as prognostic variables.
This data set has been published in D Kalbfleisch and RL Prentice (1980), The Statistical Analysis of Failure Time Data. Wiley, New York.
A snapshot of the data set in shown below:
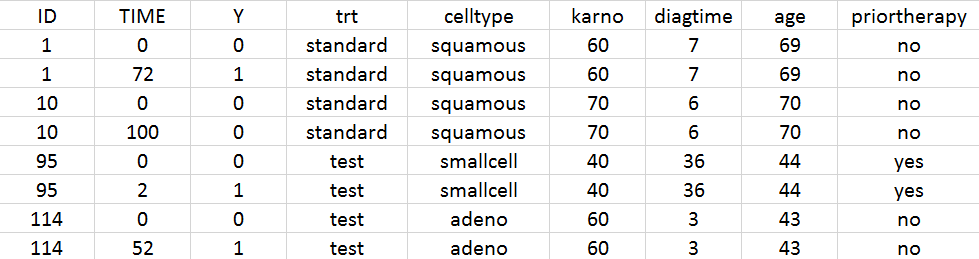
The TIME and Y columns are interpreted in the following way: the observation period for individual 1 start at time 0 and the event occurs at time 72 (i.e 72 days after the enrollment). For individual 10, the start time is also 0 and by the end of the observation period for this individual at time 100, no event has yet occurred.
The structure of the data file is the following:
-
ID: ID of the patient, column-type ID
-
TIME: time of start of the observation period (if Y=0, first occurrence), death (if Y=1) or censoring (if Y=0, second occurrence), column-type TIME.
-
Y: 0 to indicate the start of the observation period or censoring and 1 to indicate death, column-type OBSERVATION.
-
trt: treatment type, column-type CATEGORICAL COVARIATE
-
celltype: histological type of the tumor, categorical covariate, column-type CATEGORICAL COVARIATE
-
karno: Karnofsky performance score that describes the overall patients status at the beginning of the study, column-type CONTINUOUS COVARIATE
-
diagtime: Time between diagnosis and start of the study (in month), column-type CONTINUOUS COVARIATE
-
age: age of the patient (in years), column-type CONTINUOUS COVARIATE
-
priortherapy: indicates if the patient has received another therapy before the current one, column-type CATEGORICAL COVARIATE
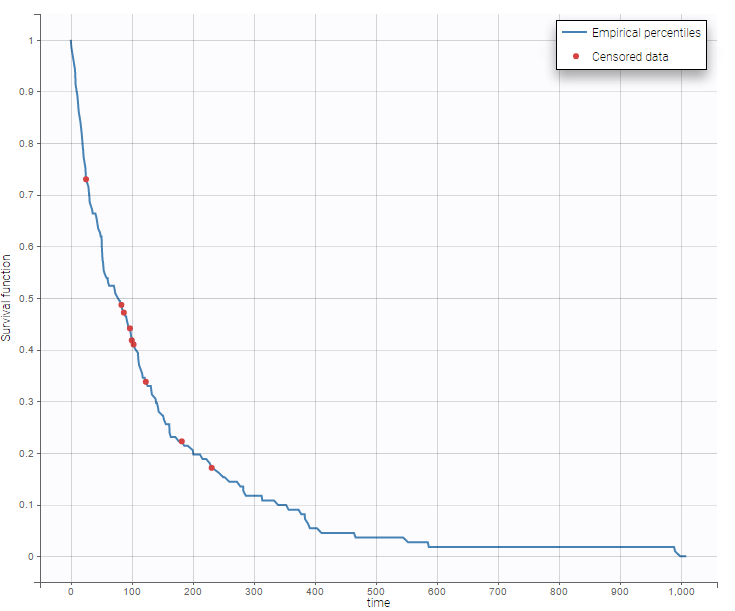
Using Monolix, one can visualize the Kaplan-Meier curve. The censored data are indicated by red points.