Crohn’s Disease Adverse Events data set
Download data set: crohnAdverseEvent.csv
Data set issued from a study of the adverse events of a drug on 117 patients affected by Crohn’s disease (a chronic inflammatory disease of the intestines). In addition to the response variable AE (number of adverse events), 7 explanatory variables were recorded for each patient: BMI (body mass index), HEIGHT, COUNTRY (one of the two countries where the patient lives), SEX, AGE, WEIGHT, and TREAT (the drug taken by the patient in factor form: placebo, d1, d2).
Below is an extract of the data set:

The definition of the columns is the following:
ID: subject identifier, column-type ID
TIME: constant to 0, column-type TIME. This column is mandatory. Thus all the values are fixed to 0 as there is only one evaluation.
nrAdvE: the number of adverse events during the period, column-type OBSERVATION.
BMI: body mass index, column-type CONTINUOUS COVARIATE
height: height of the subject in cm, column-type CONTINUOUS COVARIATE
country: country of the subject, column-type CATEGORICAL COVARIATE
sex: sex of the subject (M or F), column-type CATEGORICAL COVARIATE
age: age of the subject (in year), column-type CONTINUOUS COVARIATE
weight: weight of the subject in kg, column-type CONTINUOUS COVARIATE
treat: type of treatment, placebo, d1, or d2, column-type CATEGORICAL COVARIATE
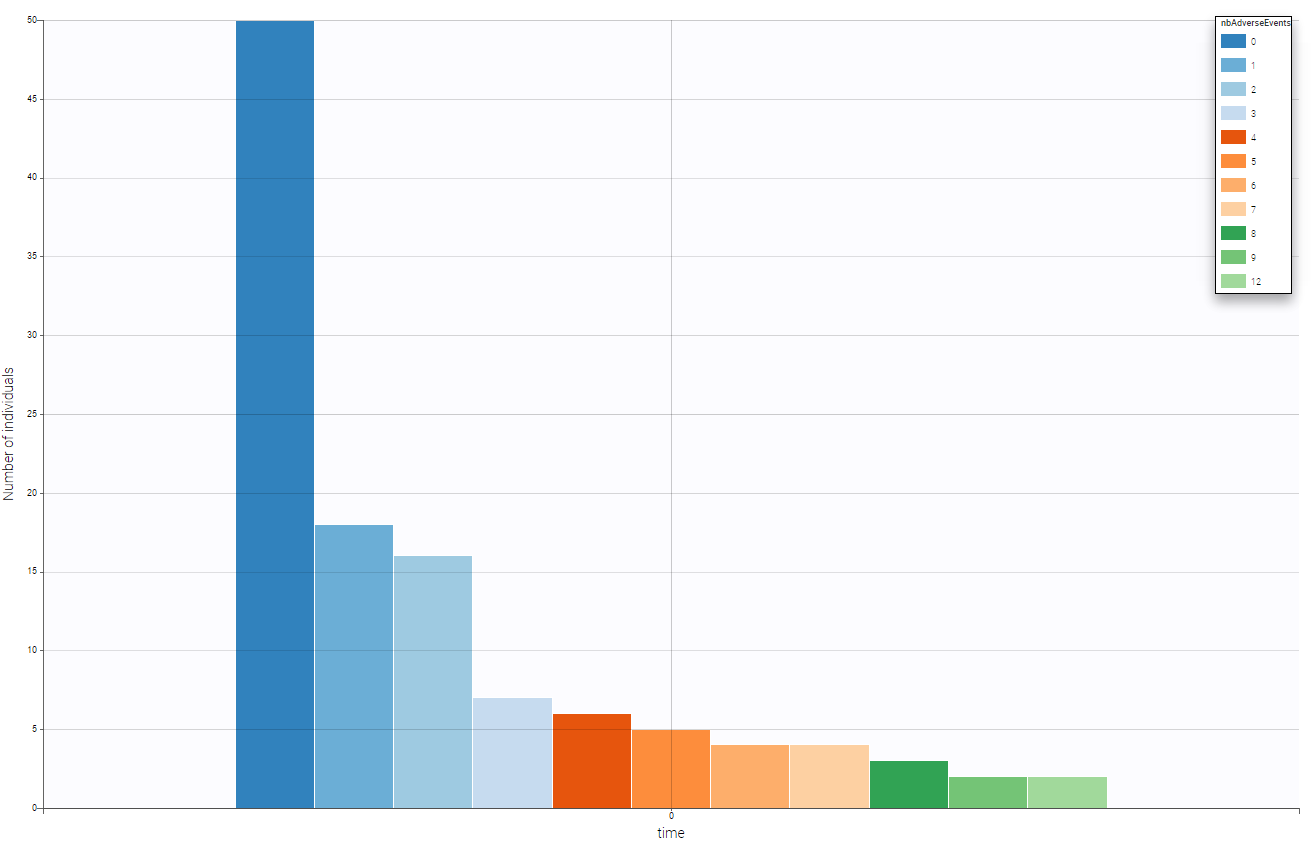
We can see on the following figure the number of adverse events on that period providing a global evaluation of the number of adverse events over the population.

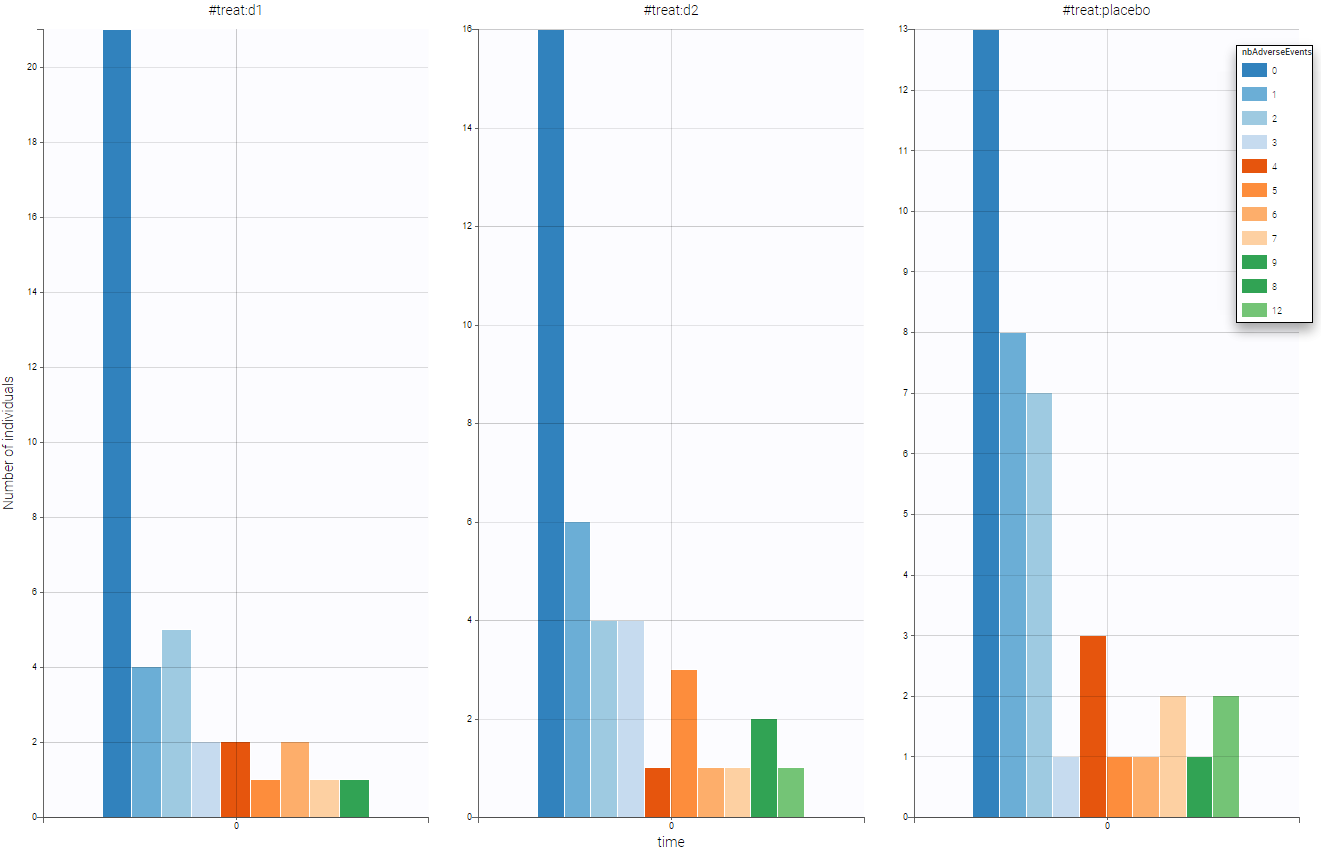
One can split by the categorical covariate treat and see if this covariate as an impact on the number of adverse events. As we can see on the following figure, the drugs seem efficient has we notice that the number of adverse event decrease when drug is used.

One can also stratify by the other covariate to have a first idea of the dependencies before the statistical population analysis using Monolix.
