Download data set: lung_cancer.csv
The North Central Cancer Treatment Group (NCCTG) data set records the survival of patients with advanced lung cancer, together with assessments of the patients performance status measured either by the physician and by the patients themselves. The goal of the study was to determine whether patients self-assessment could provide prognostic information complementary to the physician’s assessment. The data set contains 228 patients, including 63 patients that are right censored (patients that left the study before their death).
This data set has been originally presented and analyzed in Loprinzi et al. (1994). Prospective evaluation of prognostic variables from patient-completed questionnaires. North Central Cancer Treatment Group. Journal of Clinical Oncology : Official Journal of the American Society of Clinical Oncology, 12(3), 601–607.
A snapshot of the data set is displayed below:
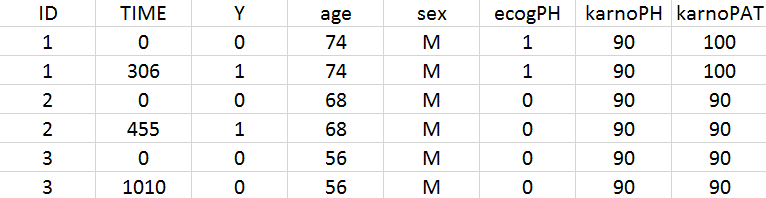
The observation period for individual 1 start at 0 and the death event is observed at time 306. On the opposite, individual 3 left the study at time 1010, before his death.
The meaning of the columns is the following:
-
ID: ID of the patient, column-type ID
-
TIME: time of start of the observation period (if Y=0, first occurrence), death (if Y=1) or censoring (if Y=0, second occurrence), column-type TIME.
-
Y: 0 to indicate the start of the observation period or censoring and 1 to indicate death, column-type OBSERVATION.
-
age: age of the patient (years), column-type CONTINUOUS COVARIATE
-
sex: sex of the patient (F for female, M for male), column-type CATEGORICAL COVARIATE
-
ecogPH: ECOG (Eastern Cooperative Oncology Group) performance status assessed by the physician, on a scale from 0 (fully active) to 5 (dead). For information on the scale, click here, column-type CATEGORICAL COVARIATE
-
karnoPH: Karnofsky performance status, assessed by the physician, on a scale from 0 (dead) to 100 (completely healthy). More details about the scale can be found here, column-type CONTINUOUS COVARIATE.
-
karnoPAT: Karnofsky performance status, assessed by the patient, column-type CONTINUOUS COVARIATE
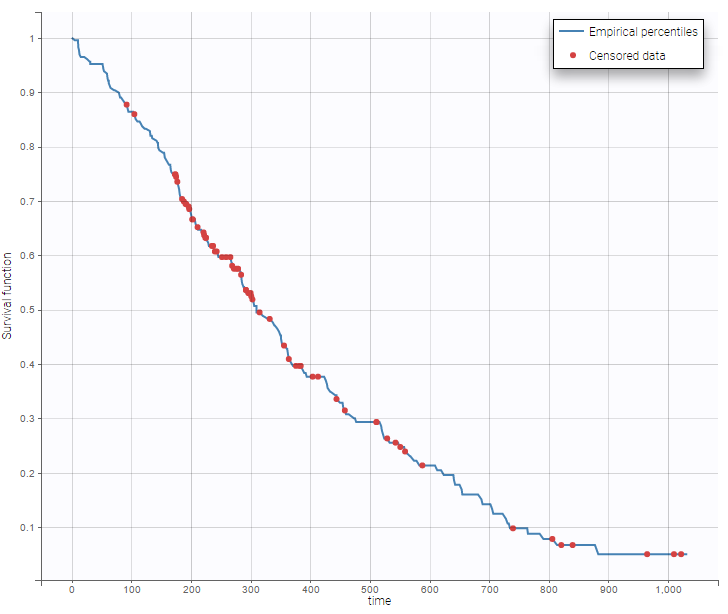
Using Monolix, one can visualize the Kaplan-Meier curve. The censored data are indicated by red points.