Data exploration
Data exploration
Once the dataset has been tagged and accepted:
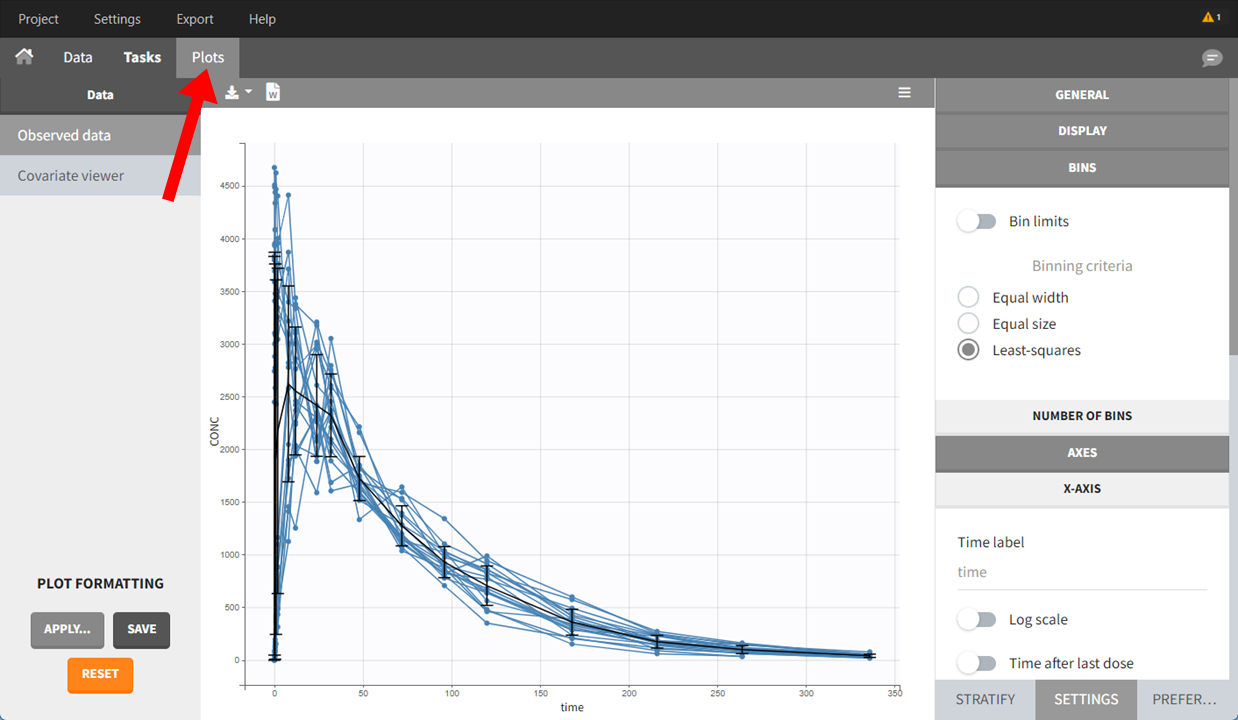
Plots are automatically generated based on the interpreted dataset to help you explore the data before running any of the tasks.

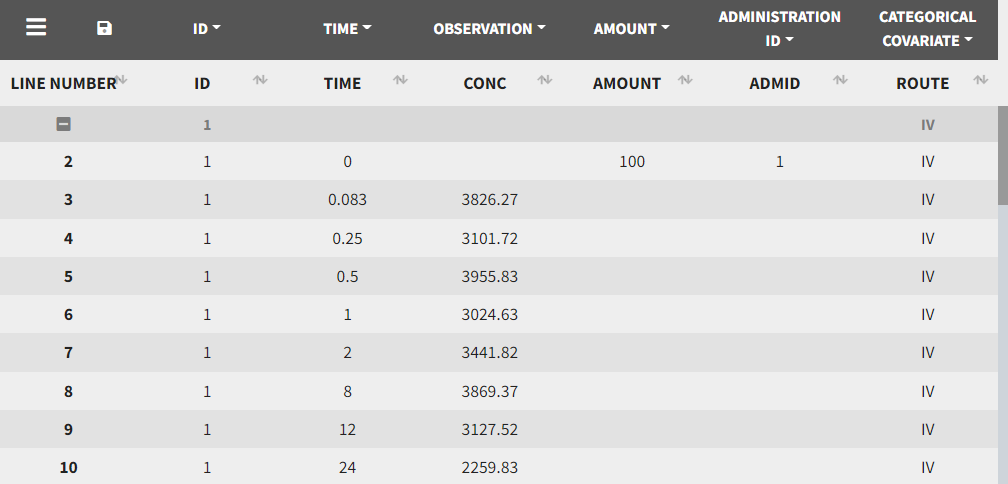
The interpreted dataset appears in Data tab, which shows the final dataset after formatting, setting units, and filtering.

Covariate Statistics appear in a section of the data tab.

