
Overview
One of the main feature of PKanalix is the calculation of the parameters in the Noncompartmental Analysis framework.
NCA task
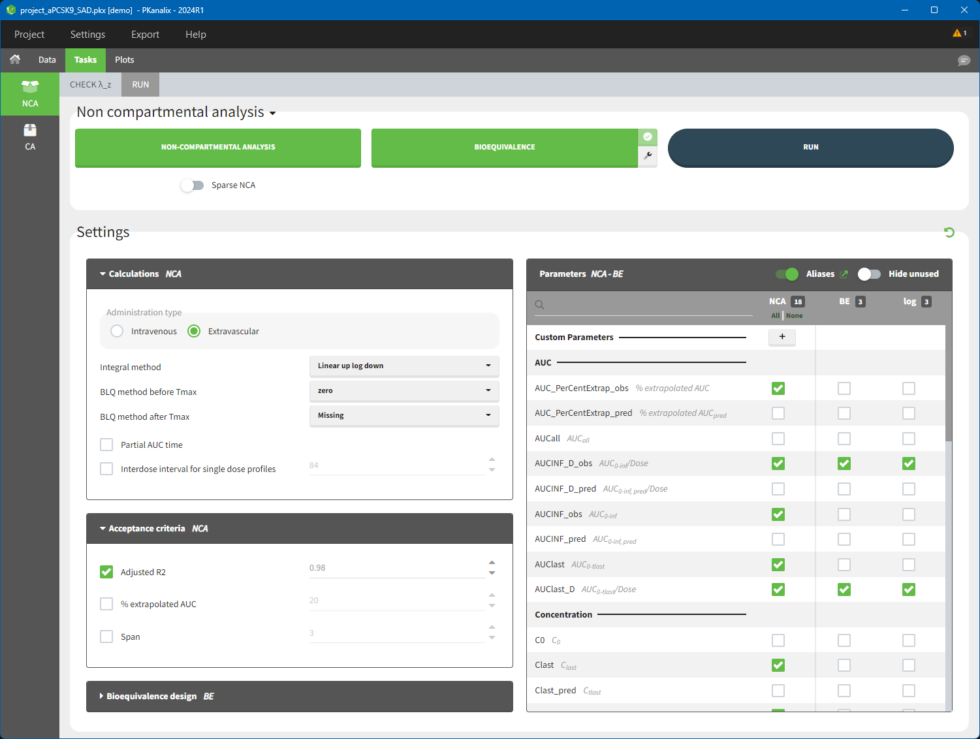
The main function of PKanalix is to calculate PK metrics (noncompartmental parameters). In the Tasks tab, there is a dedicated section called “NCA” (left panel). There are two subtabs: RUN and CHECK λz.
-
The RUN tab contains a section with calculation task buttons (for non-compartmental analysis and bioequivalence) and the corresponding settings: calculation, acceptance criteria, parameters and bioequivalence design. The meaning of all the settings and their defaults is documented in a separate page here.
-
The CHECK λz tab allows defining the calculation of λz. It is a graphical preview of the data for each individual and the regression line, more details are here.
To calculate NCA parameters, click on the button NON-COMPARTMENTAL ANALYSIS. When you click on RUN button, PKanalix runs all selected tasks (those tasks which are enabled and shown in green). Results and plots are automatically generated in separate tabs.
NCA results
When you run the NCA task, results are automatically generated and displayed in the RESULTS tab. There are three tables: individual estimates, summary and points for λ_z.
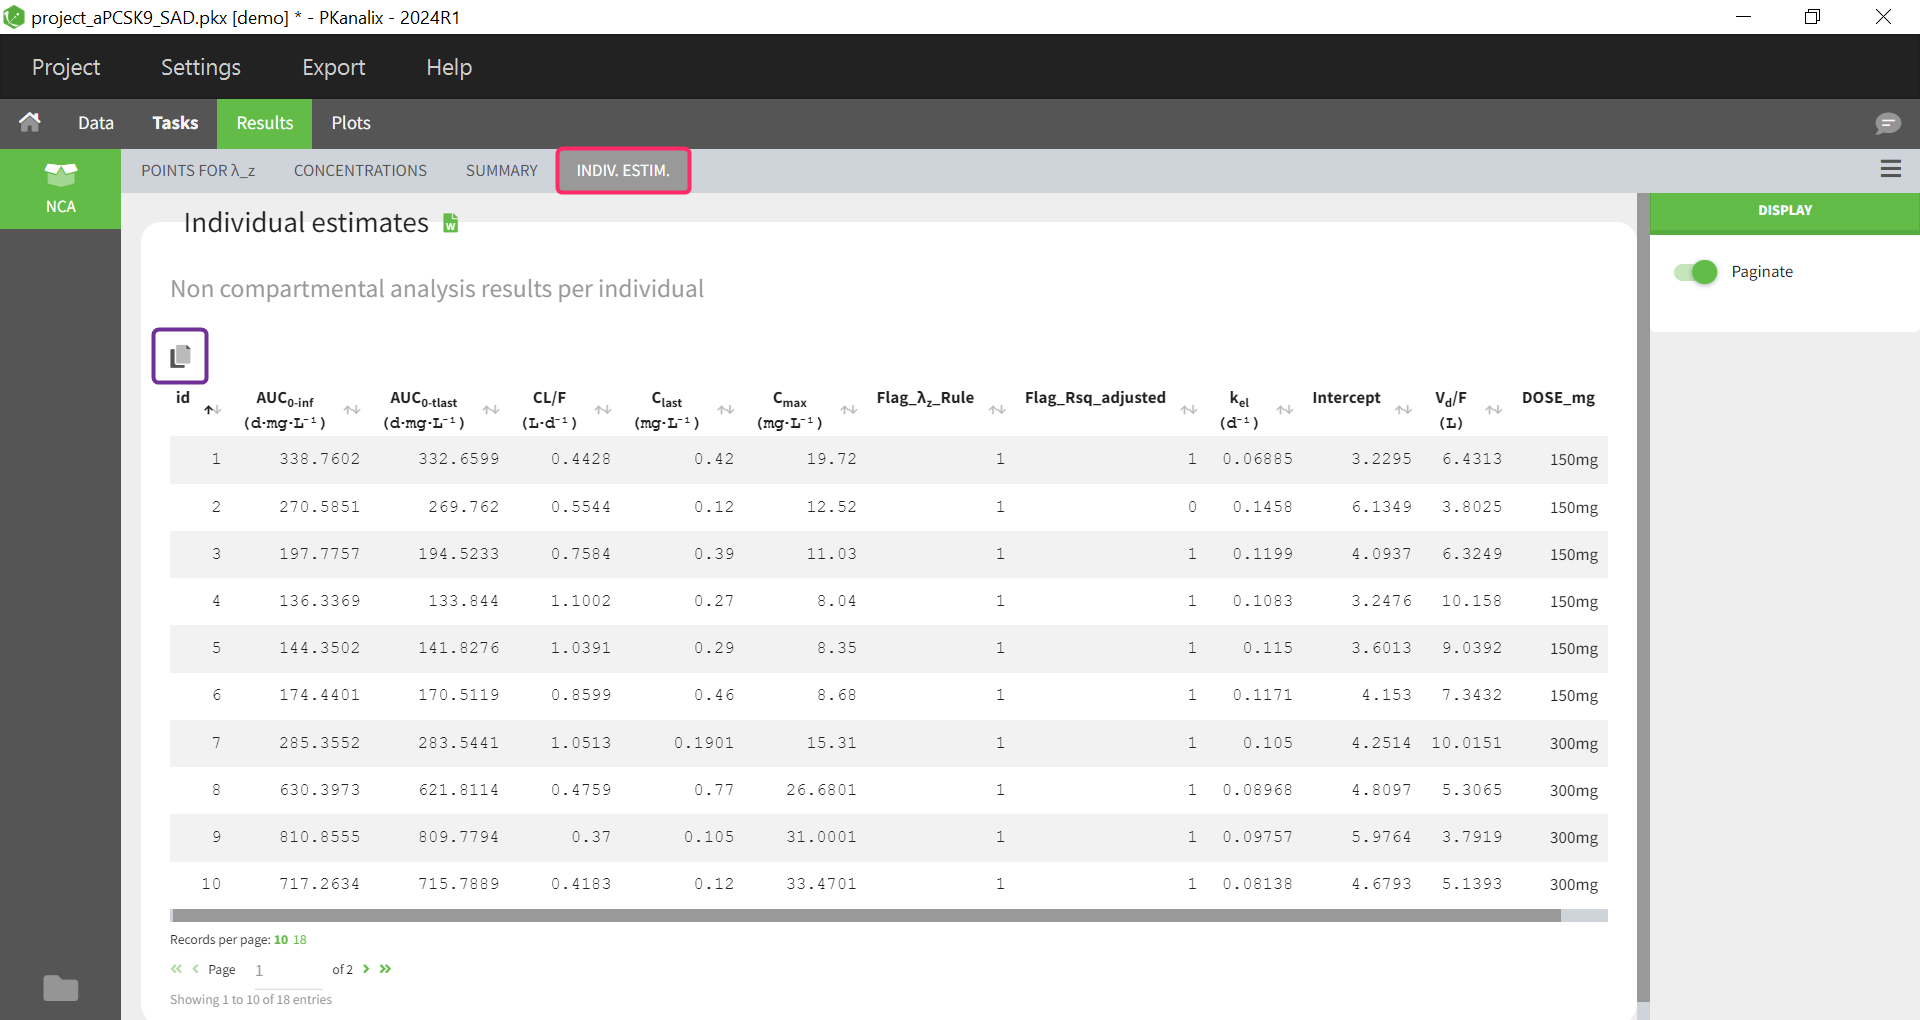
Noncompartmental analysis results per individual
Individual estimates of the NCA parameters are displayed in a table in the tab “INDIV. ESTIM.”
All the computed parameters depend on the type of observation and administration. Description of all the parameters is here. You can copy this table to a word or an excel file using the icon at the top right (indicated with the purple box).
Summary statistics on NCA results
Statistics on non-compartmental parameters are displayed in a summary table in the sub-tab “SUMMARY”. A description of all the summary calculations is here.
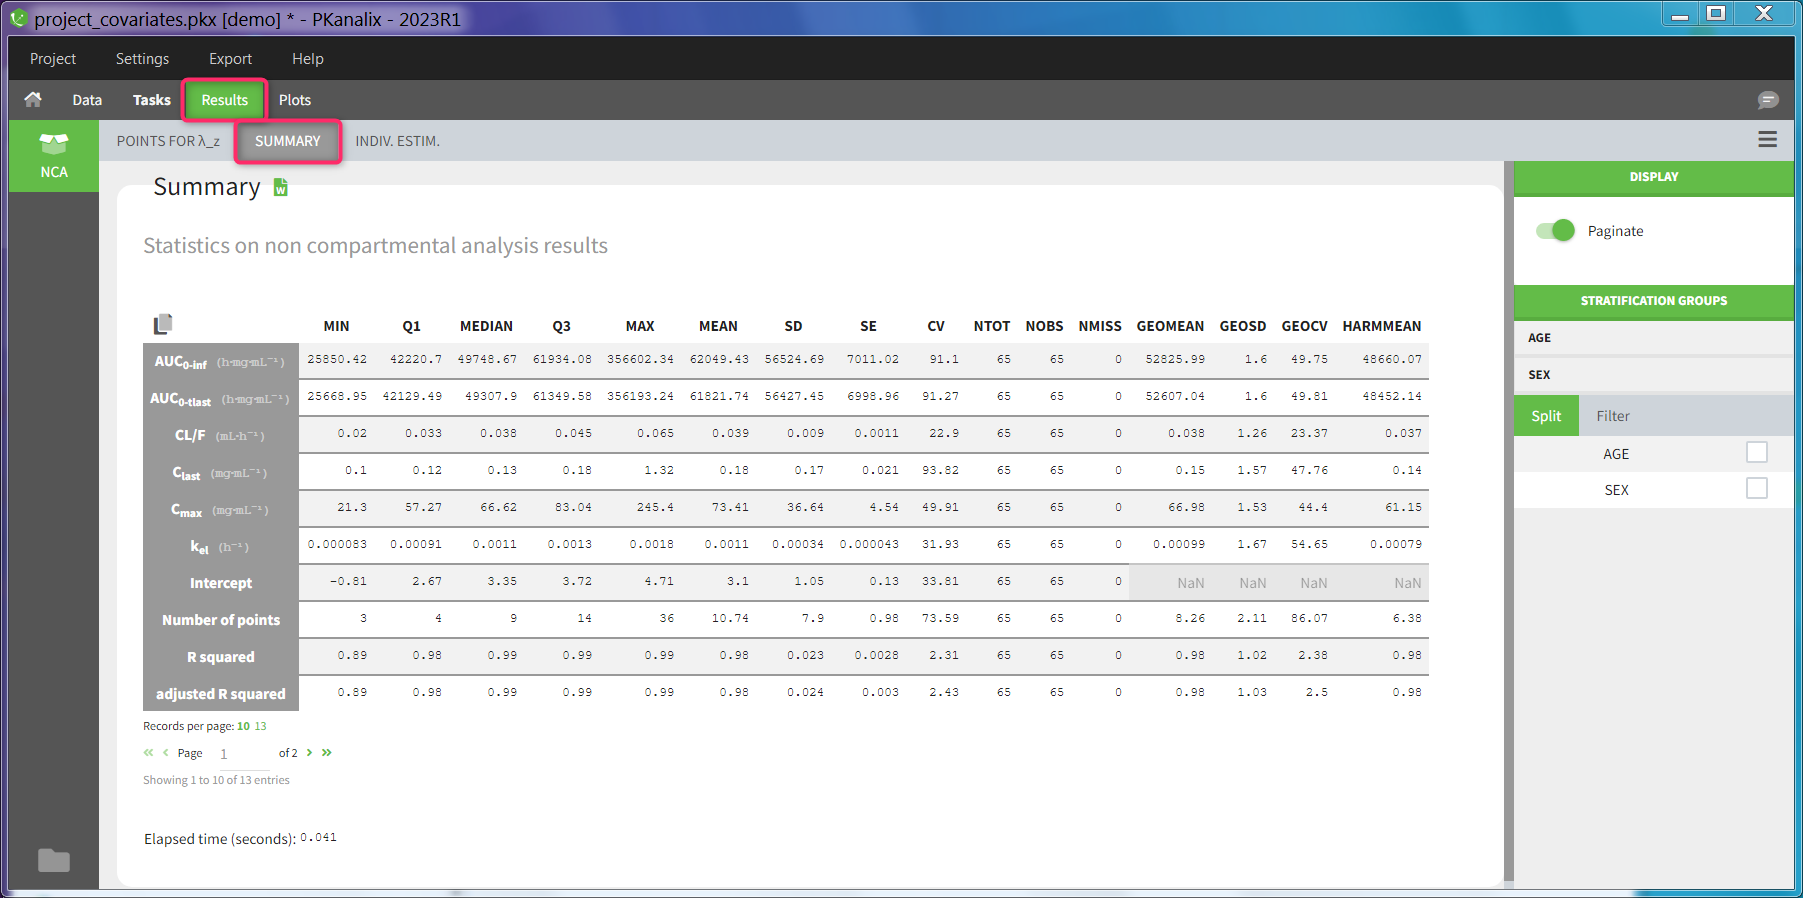
The summary table can be
-
split and filtered according to the categorical and continuous covariates tagged in the data set
-
filtered according to the acceptance criteria defined in the NCA settings
-
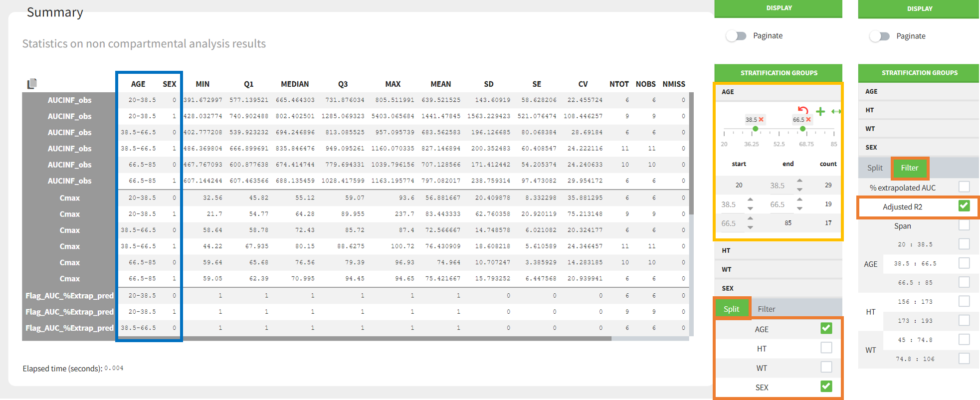
Split by covariates: When you apply “split” to a table, the values of the splitting covariates are displayed in the first columns of the summary table (blue highlight). The order of these columns corresponds to the order of the clicks to setup the splitting covariates (orange highlight). You can discretize continuous covariates into groups by defining the group limits (yellow highlight), and create new categories for categorical covariates (drag and drop to merge existing categories).
It is currently not possible to split the table in several subtables (instead of splitting the rows), nor to choose the orientation of the table (NCA parameters as columns for instance). See the reporting documentation for details how these options can be applied in a report. -
Filter by acceptance criteria: you can remove parameter values from subjects that do not meet the acceptance criteria from the calculations in the summary table.
When you save a PKanalix project, the stratification settings of the results are saved in the result folder and are reloaded when reloading a PKanalix project. The table in the <result folder>/PKanalix/IndividualParameters/nca/ncaIndividualParametersSummary.txt takes into account the split definition. This table is generated when clicking “run” in the task tab (usually without splits, as the result tab is not yet available to define them) and also upon saving the project (with splits if defined).
Table of concentrations
With MonolixSuite version 2024, a table of concentrations is now generated after each NCA run. It can either be displayed as a summary table or as a table for individual concentrations.
Summary table of concentrations
This table is displayed by default. The columns contain the concentrations at different time points, which are summarized for different descriptive metrics shown per row.

If nominal time is available in the dataset, the concentrations are automatically summarized using nominal time points. By deselecting ‘Use nominal time’ in the right panel, the table can also be displayed based on the actual time contained in the dataset.
The same stratification and filter options are available as for the NCA summary table described above.
The rules set in the NCA task tab for handling censored data are also used in the calculation of the descriptive statistics.
Table of individual concentrations
This table can be displayed in the same tab by enabling the toggle “Display individual profiles” in the right-hand side panel.
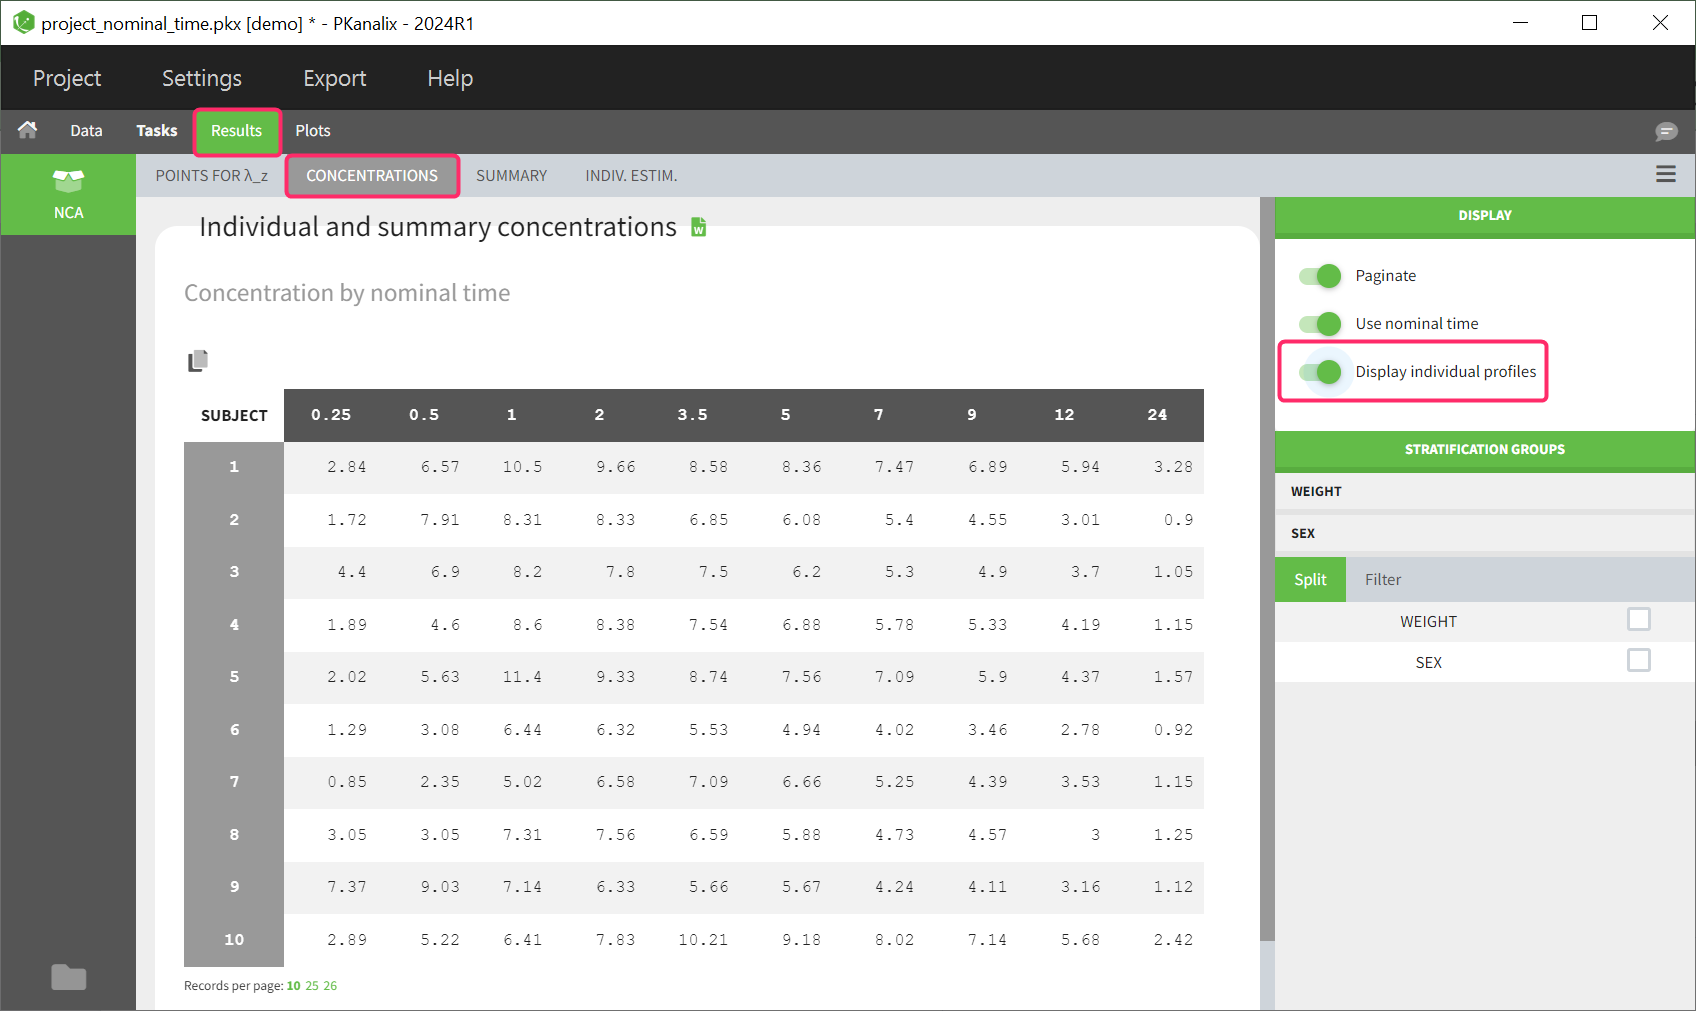
Each row in the table corresponds to an individual. The columns correspond to the different time points. There are options for stratification and filtering. Additionally, displaying the columns based on either nominal time or actual time points is possible. Extrapolated points at dosing time are not displayed in the table as well as unused data for NCA, such as data points before last dose or negative values.
If the dataset contains left censored data, these will be displayed in the individual table of concentrations using the “<LLOQ>” tag.
Ratios for NCA parameters
With MonolixSuite version 2024, parameter ratios can be calculated. Once this task has been performed, the results are displayed in 2 different tables in the results tab, as a summary table and as a table of individual ratios.
Summary table of ratios
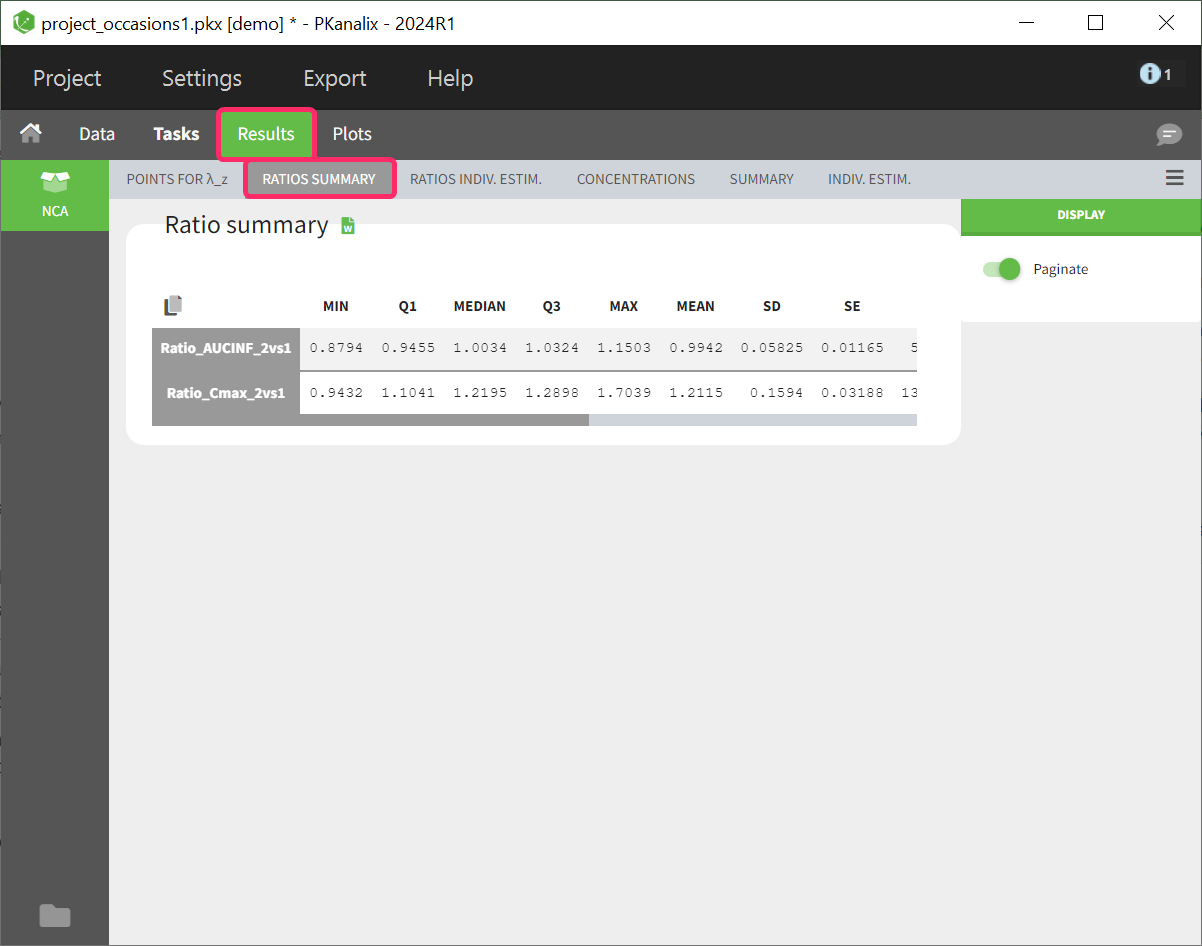
The calculated parameter ratios are presented using basic descriptive statistics. However, even if the dataset contains additional covariates or occasions, this table cannot be further stratified.
Table of ratios per individual
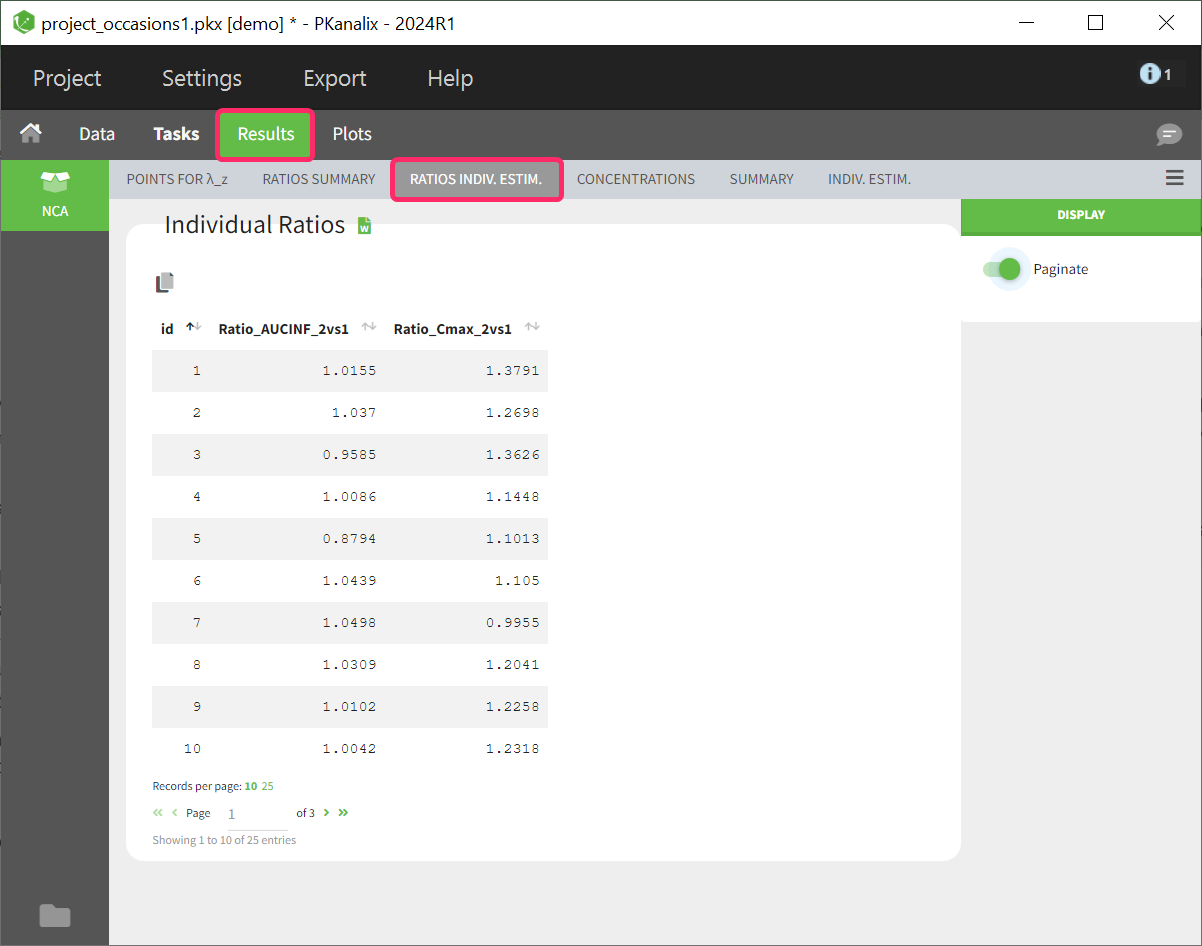
The parameter ratio is calculated per individual. This table shows a list sorted by subject identifier. The number of columns in the table depends on how many ratios have been defined. If a ratio couldn’t be calculated for a subject, such as due to missing values, NaN is displayed as the entry for the corresponding ratio parameter.
Points for lambda_z
In the sub-tab “POINTS FOR λ_z ”, there is a table of concentration points used for the terminal slope (λz) calculation.
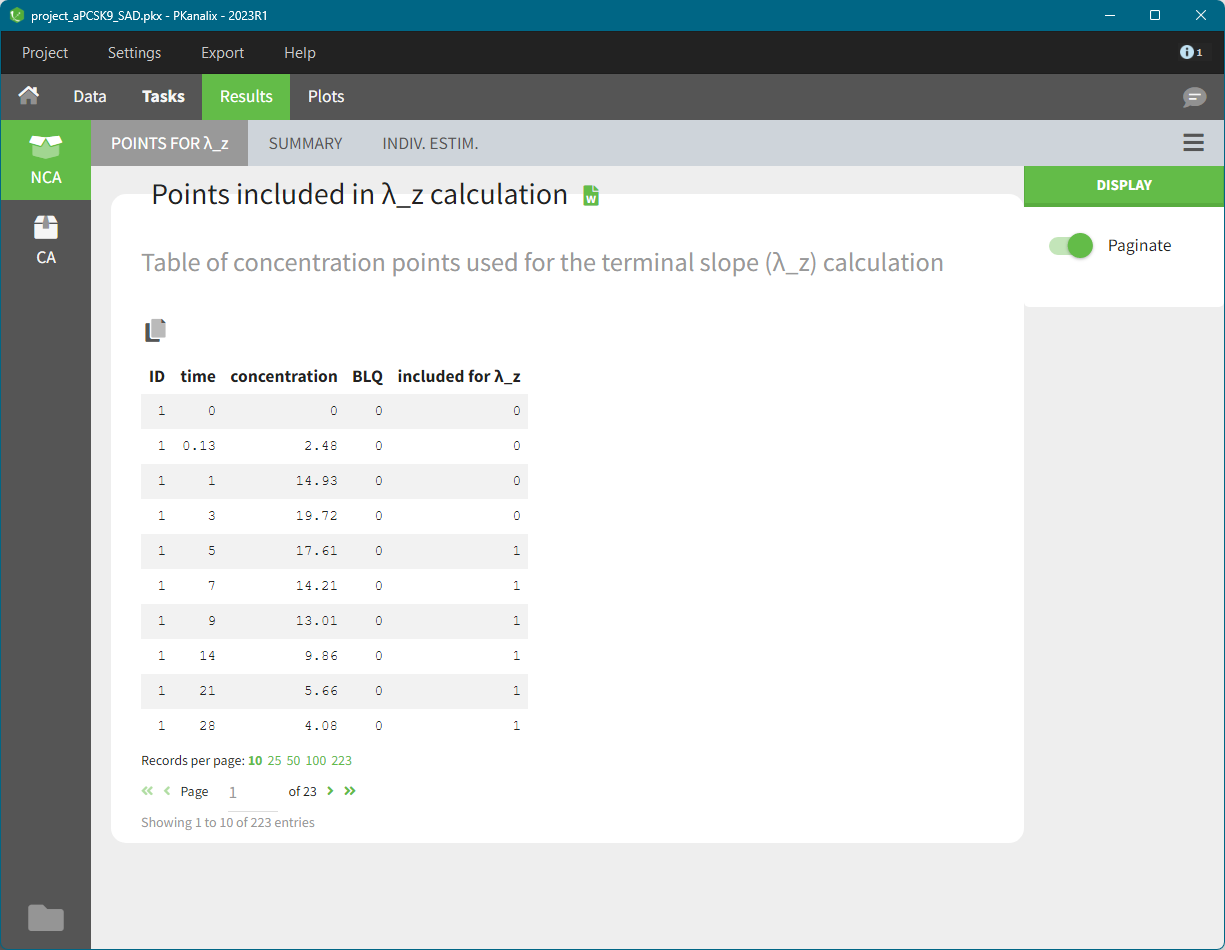
This table is displayed only if the number of rows is less than 5000. Above this, the tab appears as usual but with incomplete data. You can find the full table in the result folder: <result folder>/PKanalix/IndividualParameters/nca/pointsIncludedForLambdaZ.txt.
NCA plots
The PLOTS tab shows plots for the individual parameters:
-
Correlation between NCA parameters: displays scatter plots for each pair of parameters. You can identify correlations between parameters, which can be used to see the results of your analysis and see the coherence of the parameters for each individual.
-
Distribution of the NCA parameters: shows the empirical distribution of the parameters. You can verify the distribution of the parameters over the individuals.
-
NCA parameters w.r.t. covariates: displays the individual parameters as a function of the covariates. You can identify correlation effects between the individual parameters and the covariates.
-
NCA individual fits: shows the lambdaZ regression line for each individual.
-
NCA data: observations are displayed in the same way as in the Observed data plot, taking into account the selected NCA settings in the NCA task tab.
NCA outputs
After running the NCA task, the following files are available in the result folder: <resultFolder>/PKanalix/IndividualParameters/nca
-
Summary.txt contains the summary of the NCA parameters calculation, in a format easily readable by a human (but not easy to parse programmatically)
-
ncaIndividualParametersSummary.txt contains the summary of the NCA parameters in a structured format.
-
The first column corresponds to the name of the parameter
-
The second column corresponds to the CDISC name of the parameter
-
The other columns correspond to the several elements describing the summary of the parameters (as explained here)
-
-
ncaIndividualParameters.txt contains the NCA parameters for each subject-occasion along with the covariates.
-
The first row corresponds to the name of the parameter
-
The second row corresponds to the CDISC name of the parameter
-
The other rows correspond to the parameter values
-
-
pointsIncludedForLambdaZ.txt contains the concentration points used for each individual for the lambda_z calculation.
-
id: individual identifiers
-
occ: occasions (if present). The column header corresponds the data set header of the column(s) tagged as occasion(s).
-
time: time of the measurements
-
concentration: concentration measurements as displayed in the NCA individual fits plot (i.e after taking into account the BLQ rules)
-
BLQ: if the data point is a BLQ (1) or not (0)
-
includedForLambdaZ: if this data point has been used to calculate the lambdaZ (1) or not (0)
-
The files ncaIndividualParametersSummary.txt and ncaIndividualParameters.txt can be opened in R using the following command
read.table("/path/to/file.txt", sep = ",", header = TRUE)
Remarks
-
To load the individual parameters using PKanalix name as headers, you need to remove the row after the header
ncaParameters = read.table("/path/to/file.txt", sep = ",", header = TRUE); ncaParameters[-1,] # to remove the CDISC name line -
To load the individual parameters using CDISC as headers, you need to skip the first row
ncaParameters = read.table("/path/to/file.txt", sep = ",", header = TRUE, skip = 1) -
In both cases, the 2 subsequent rows specifying the formatted names and units need to removed and the columns converted to numeric.
-
The separator is the one defined in the user preferences. We use “,” in this example as it is the default.