λz is the slope of the terminal elimination phase. If estimated, the NCA parameters will be extrapolated to infinity. The “check lambda_z” tab visualizes the linear regression model for each individual and allows selecting the points included in the calculation of the λz parameter.
General rule
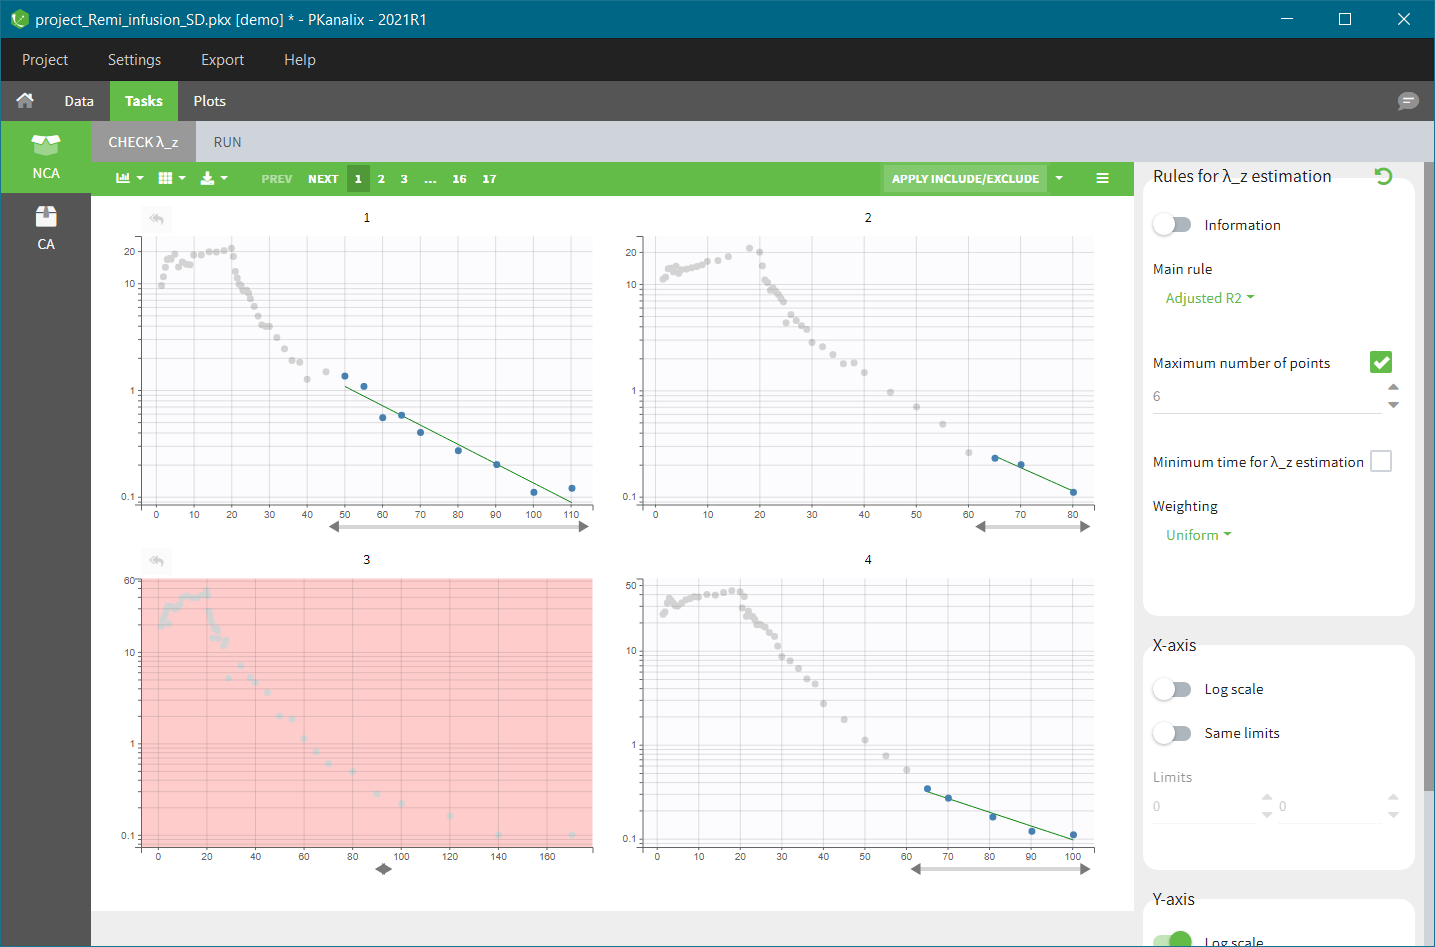
The “Check lambda_z” tab shows the data for each individual plotted by default in log-scale on the y-axis.
-
Points used in the λz calculation are in blue.
-
Points not used in the λz calculation are in grey.
-
The λz curve is in green.
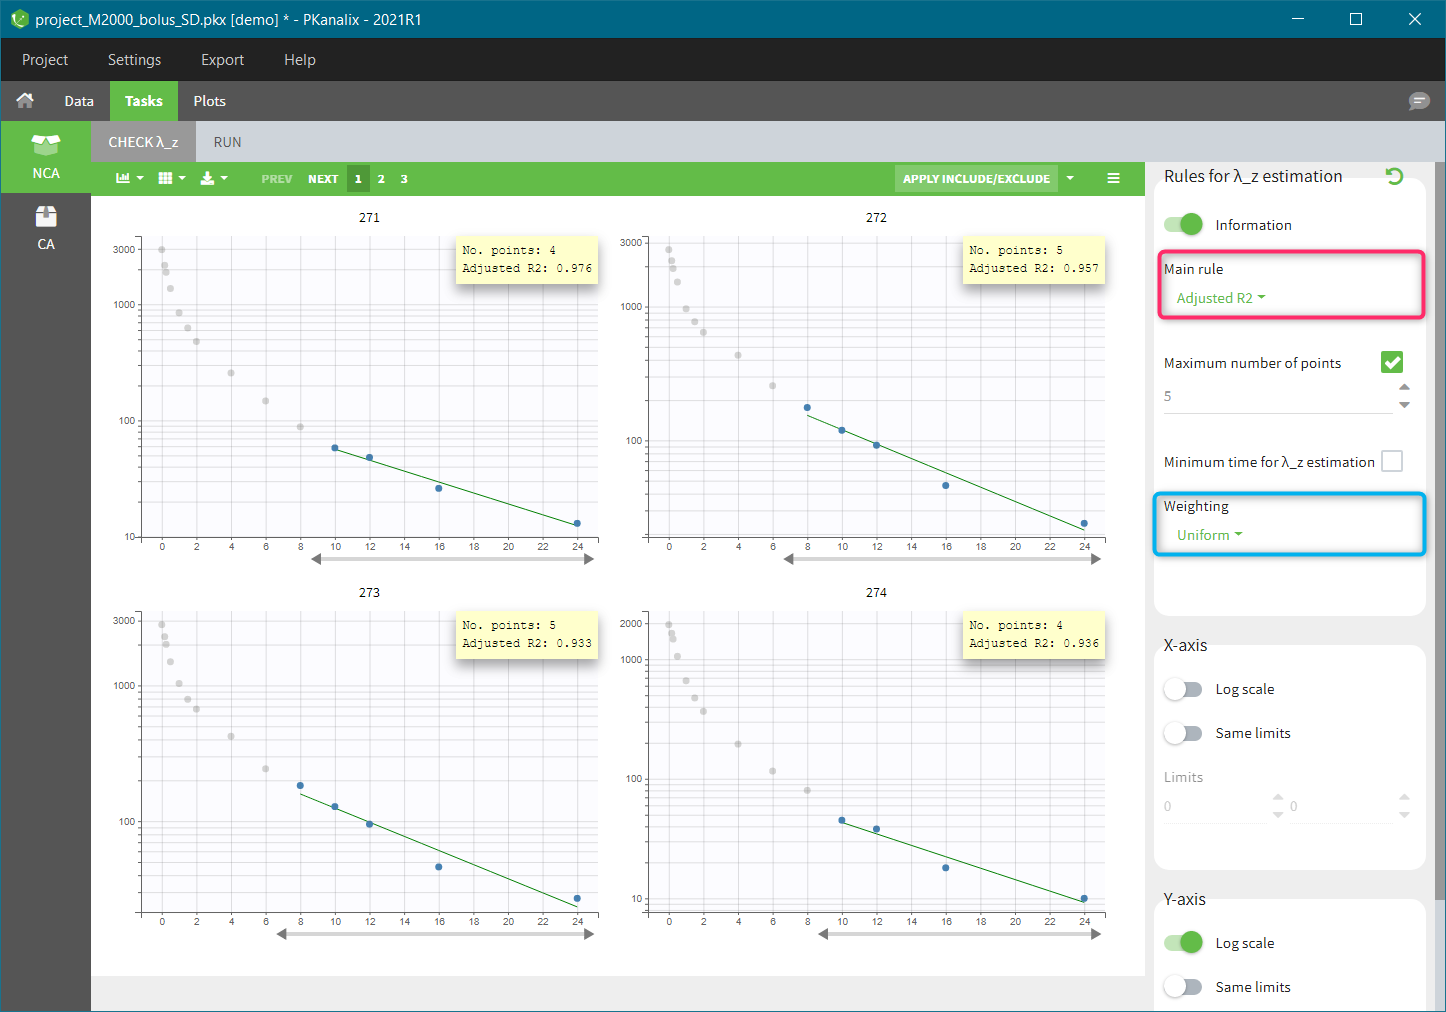
A main rule to select which points to include in the λz calculation applies to all individuals. You can find it on top in the right panel – shown with the red boxin the figure above. There are four methods that can be selected in the drop-down menu:
-
“R2” chooses the number of points that optimize the correlation coefficient.
-
“Adjusted R2” (called “Best Fit” in WinNonlin) optimizes the adjusted correlation coefficient, taking into account the number of points. The “maximum number of points” and “minimum time” allow to further restrict the points selected.
-
“Interval” selects all points within a given time interval.
-
“Points” corresponds to the number of terminal points taken into account in the calculation.
The calculation of the λz is via the linear regression. The selection of the weighting used in the cost function is in the right panel (blue highlight). Three options are available: uniform (default), 1/Y, and 1/Y^2.
See the Settings page and the Calculations page for more details. In addition to the main rule, it is possible to define more precisely (manually) which points to include or exclude for each individual.
Manual choice of measurements for the λz calculation
Plots in the “check lambda_z” tab are interactive. For each individual, specific points can be selected manually to be included or excluded from the λz calculation. There are two methods: define a range (time interval) with a slider or select each point individually.
Change of the range
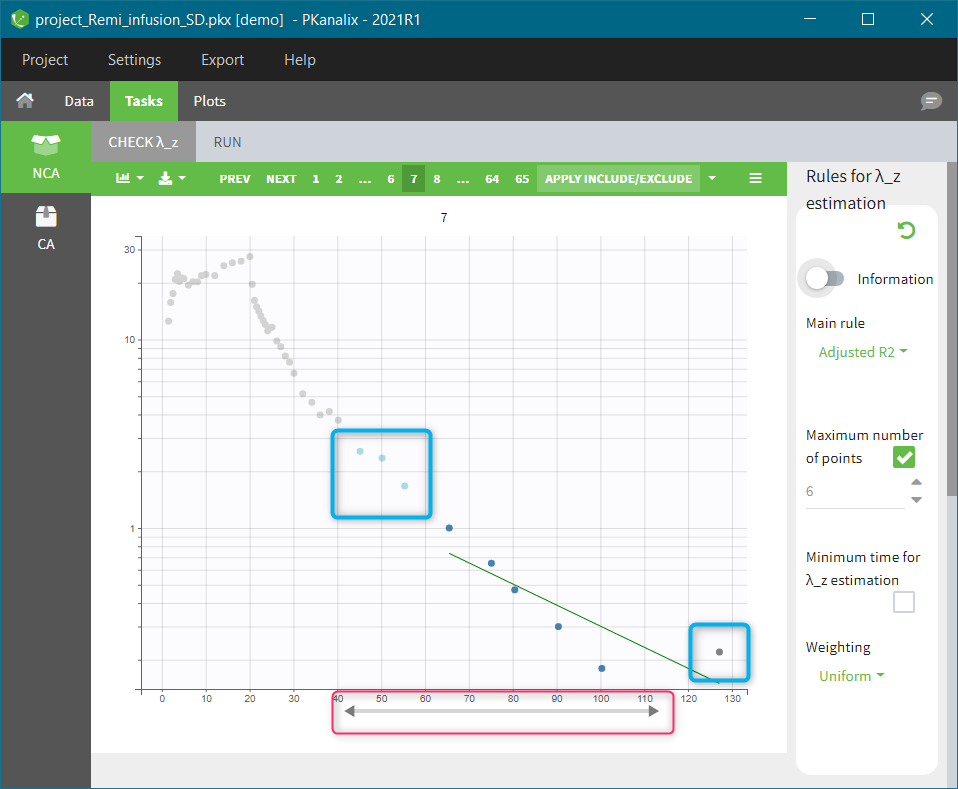
For a given individual, the grey arrow (highlighted in red) below each individual plot defines a range–the time interval in which measured concentrations are used in the lambda-z calculation. New points to include are colored in light blue, and points to remove are colored in dark grey, as shown in the following figure (highlighted in blue):
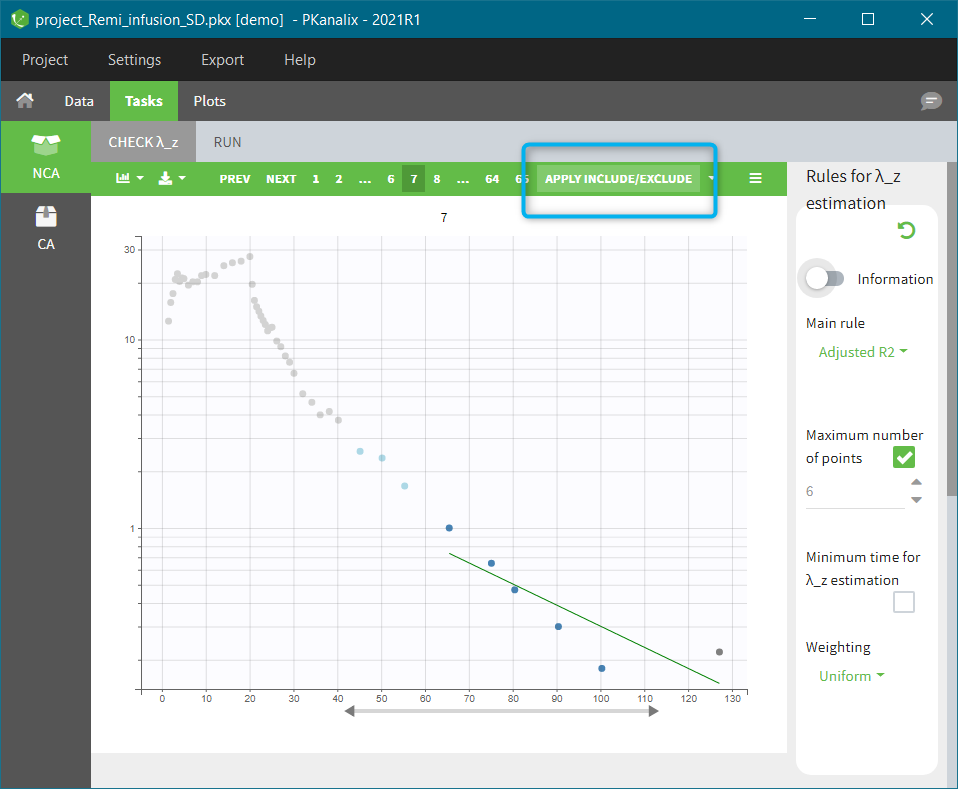
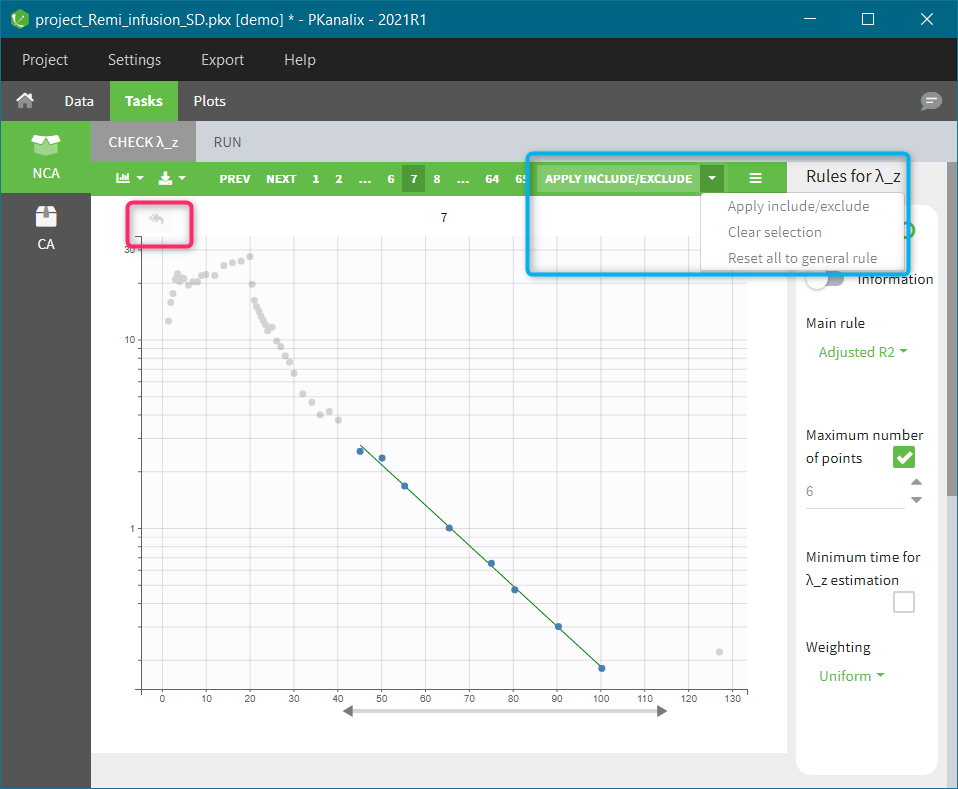
The button “Apply include/exclude” (in the top-right corner above the plot) applies the manual modifications of the points to the calculation of λz. If the modifications concern several individuals, then clicking on the “Apply include/exclude” button updates all of them automatically.
The plots are updated with new points and a new λz curve. For modified plots, a “back arrow” appears in the top-left corner (highlighted in red in the figure below). It resets the individual calculation to the general rule. The drop-down menu in the “Apply include/exclude” (blue frame) allows to reset all individuals to the general rule. Clear selection the current selection made before clicking on the “Apply include/exclude” button.
Include/exclude single points
It is possible to manually modify each point to include it in the calculation of λz or to remove it from the calculation:
-
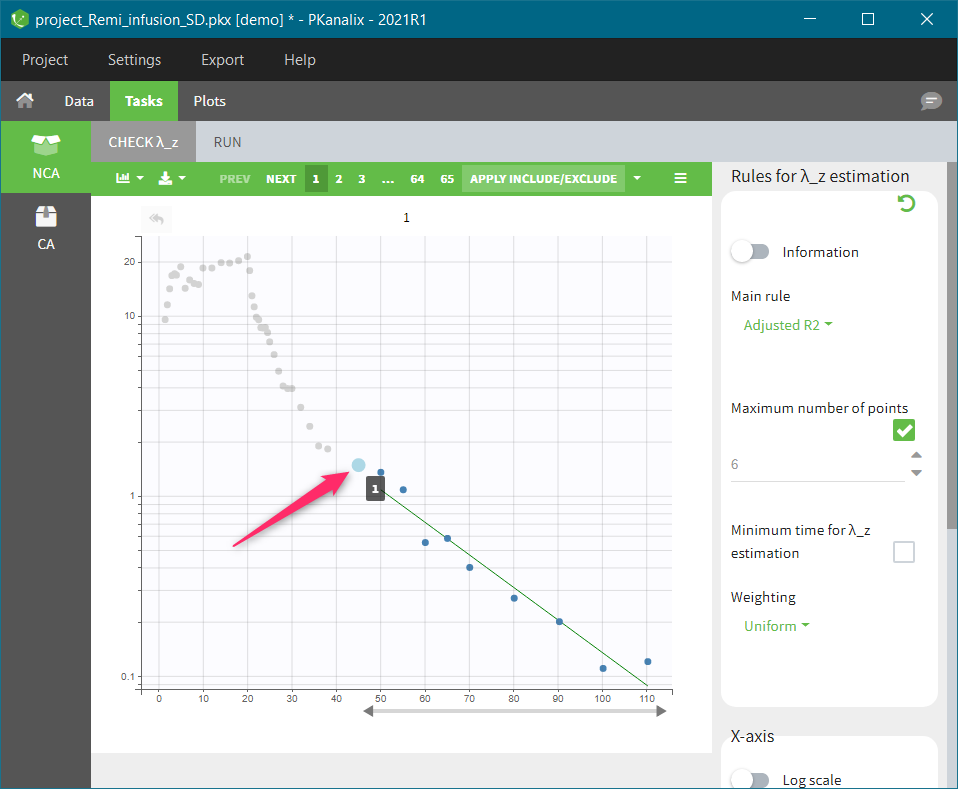
If you click on an unused point (light grey), it will change its color into light blue and will be selected for inclusion (left panel in the figure below).
-
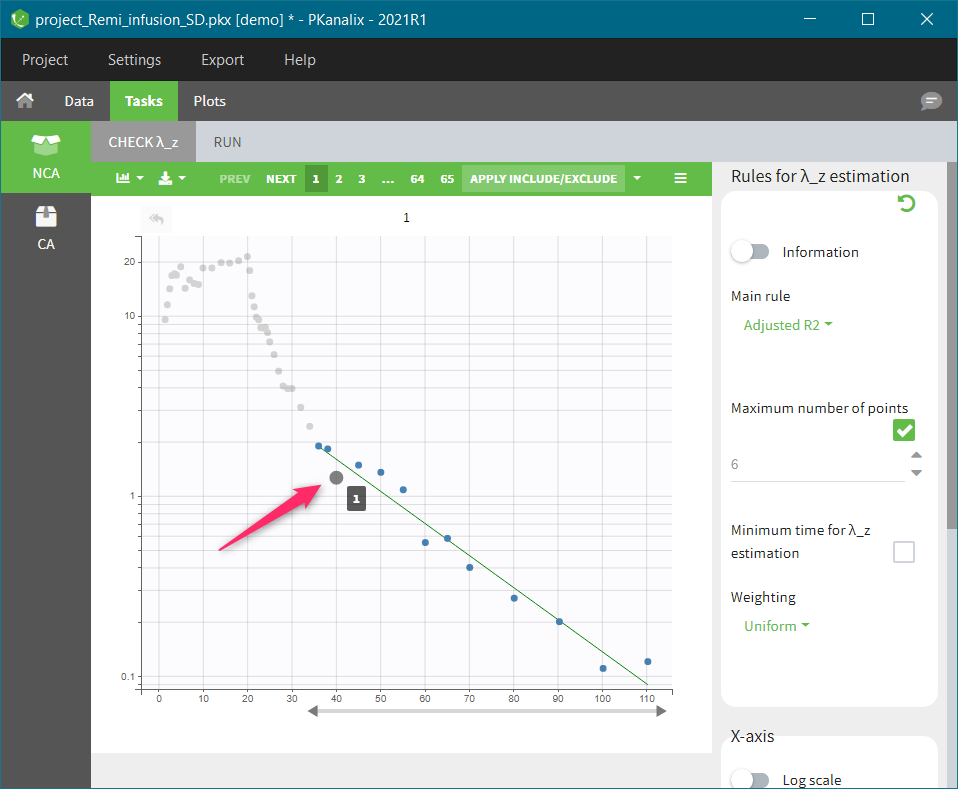
If you click on an included point (blue), it will change its color into dark grey and will be selected for exclusion (right panel in the figure below).
Clicking on the “Apply include/exclude” button applies these changes. The “back arrow” in the top-left corner of each individual plot resets the individual selection to the general rule one individual at a time, while the “Reset to general rule” button in the “Apply include/exclude” drop-down menu resets all of individuals at once.
Remarks
-
If the general rule is modified, only the individuals for which the general rule applies will be updated. Individual for which the points have been manually modified will not be updated.
-
If λz can not be computed, the background of the plot will be shown in light red as in the following figure.