Sparse data are data that have few observations per individual or per occasion, and therefore may not be sufficient to reliably estimate individual pharmacokinetic parameters. Sparse data require specific handling in an NCA analysis to get the most informative metrics from the data. PKanalix offers a dedicated mode to perform NCA analysis on sparse data, based on the calculation of mean profiles and standard errors of NCA parameters.
Set up of sparse NCA
To specify a sparse dataset, you need to go to the NCA tab and select the “Sparse NCA” toggle below the NCA task. This will enable the calculation of mean profiles based on the individual data.
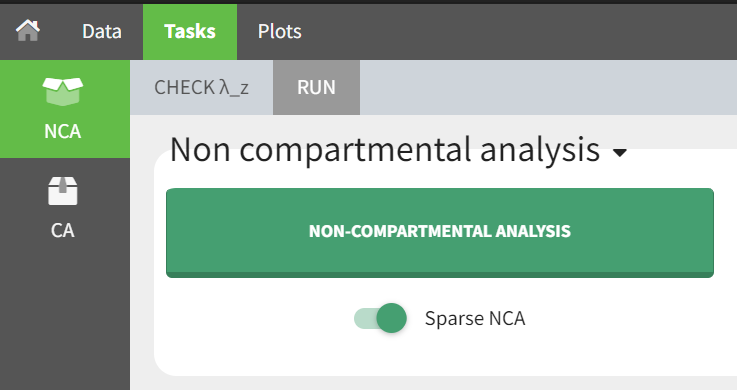
Sparse NCA is available for plasma and urine datasets.
Stratified sparse data
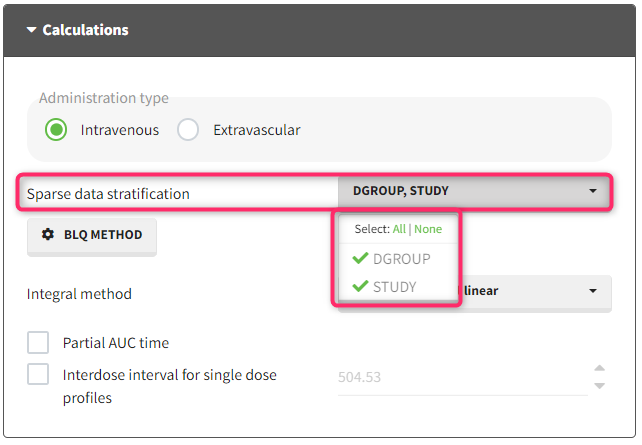
With “Sparse data stratification” in the NCA calculation settings, you can select one or more stratification covariates to group the data by categories. For example, if you have a categorical covariate indicating the treatment group, you can select it to calculate a mean profile for each treatment group. The stratification covariates must be of type “categorical covariate” or “stratification categorical covariate” in the dataset tagging.
BLQ samples
If you have censored data, you can also click on the “BLQ method” button to select a censoring rule to handle the below limit of quantification (BLQ) samples.
The available rules are:
-
Single rule: Replace all BLQ samples by [missing/zero/LOQ/(LOQ/2)]

-
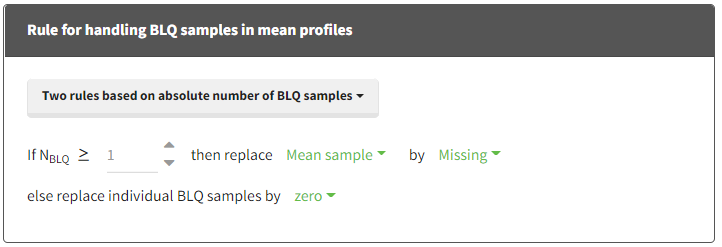
Two rules based on absolute number of BLQ samples:
if Nblq >= [number]:-
then:
-
either replace BLQ samples by [missing/zero/LOQ/(LOQ/2)]
-
or replace the mean sample by [missing/zero/LOQ/(LOQ/2)]
-
-
else replace BLQ samples by [missing/zero/LOQ/(LOQ/2)]
-
-
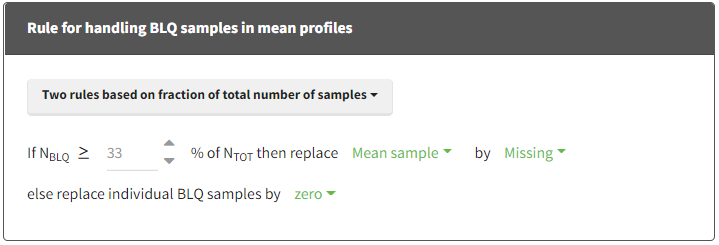
Two rules based on fraction of total number of samples:
if Nblq >= [number] % of Ntot-
then:
-
either replace BLQ samples by [missing/zero/LOQ/(LOQ/2)]
-
or replace the mean sample by [missing/zero/LOQ/(LOQ/2)]
-
-
else replace BLQ samples by [missing/zero/LOQ/(LOQ/2)]
-
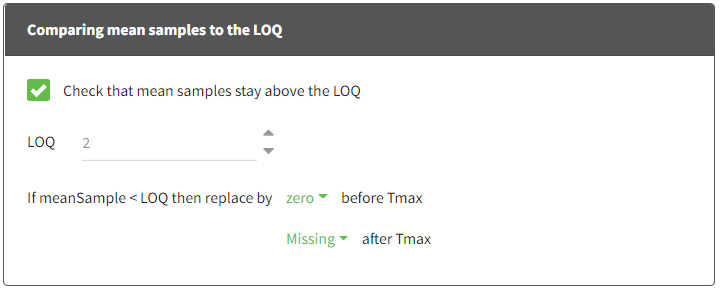
In addition, it is possible to check if the mean is below a LOQ value and add special handling in this case:
-
Check that mean samples stay above the LOQ:
If the mean sample is below [number] (LOQ usually), replace the mean sample by [missing/zero/LOQ/(LOQ/2)] before Tmax and [missing/zero/LOQ/(LOQ/2)] after Tmax.
Calculation of mean profiles
When “Sparse NCA” is selected, one or several mean profiles are calculated:
-
One mean profile per stratification group is calculated (one group for each combination of modalities from the covariates selected in “Sparse stratification”).
-
The mean profile is calculated by taking the mean concentration value across all subject-occasions for each unique time value for plasma data, or the mean rate value for each unique midpoint for urine data.
-
If a column of type NOMINAL TIME is selected, the mean profiles are calculated based on nominal time, otherwise they are calculated based on TIME.
-
If the individuals used to calculate a mean profile have different dosing regimens (different dosing times or dosing amounts), only the dosing regimen from the first individual is kept for the mean profile.
-
For urine data, if the individuals used to calculate a mean profile have different volumes for some interval, only the volumes from the first individual are kept for the mean profile.
-
Subject-occasions are handled independently for the calculation of mean profiles.
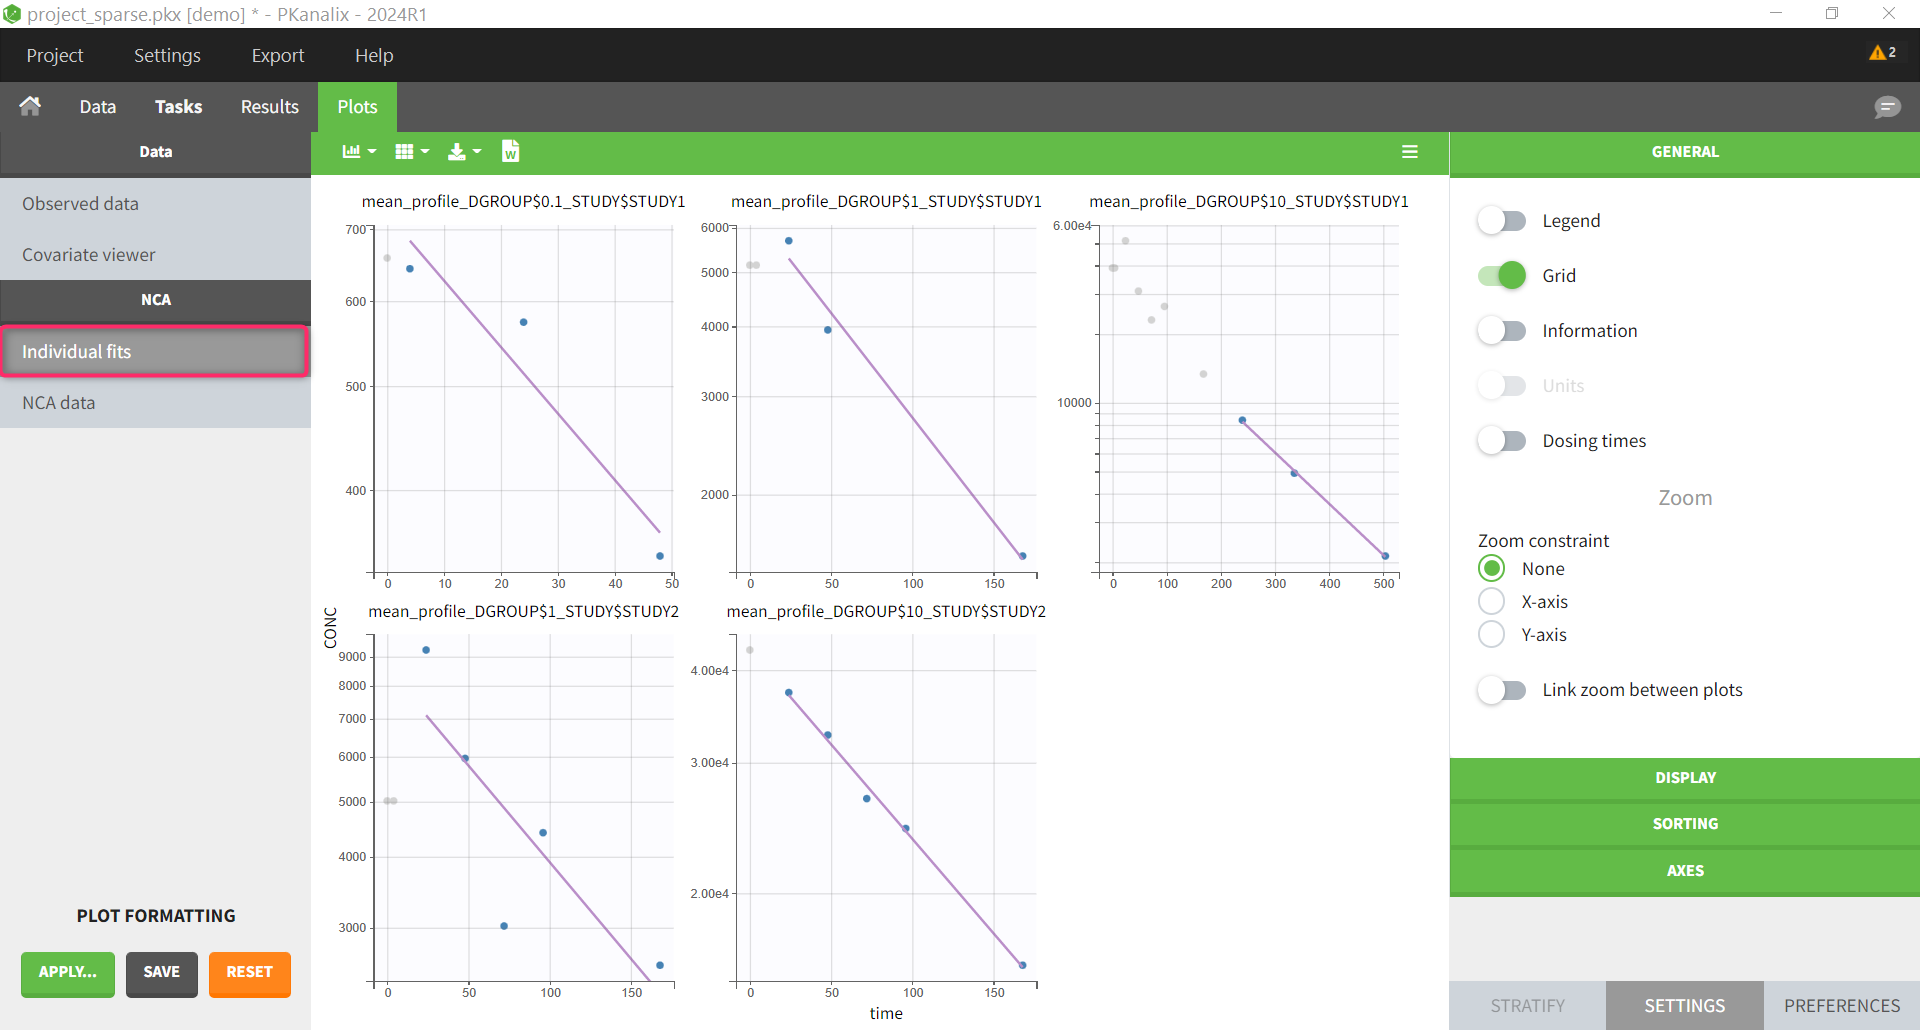
The mean profiles do not appear in the Observed data plot, but they appear in Check lambda_z and NCA individual fits.
NCA parameters specific to sparse data
All the usual NCA parameters are available in the list of parameters to compute, and in addition the following NCA parameters are available:
-
For plasma data: SE_Cmax, SE_AUClast, SE_AUCall
-
For urine data: SE_Max_Rate, SE_AURC_last, SE_AURC_all
See the page on NCA parameters for more details.
These parameters are not selected by default. SE_AUClast, SE_AUCall, SE_AURC_last, SE_AURC_all are available only if the integral method is “linear trapezoidal linear” or “linear trapezoidal linear/log” (because the formula is based on linear calculation of AUC).
Sparse NCA results
The results of the NCA analysis on sparse data are displayed in the Results and Plots tabs. The table below summarizes the results available in sparse NCA mode.
|
Result |
Based on |
|
Tables of NCA parameters |
mean profiles |
|
Table of concentrations |
individual data + mean profiles |
|
NCA data plot |
individual data + mean profiles |
|
NCA individual fits |
mean profiles |
|
Other NCA plots |
disabled |
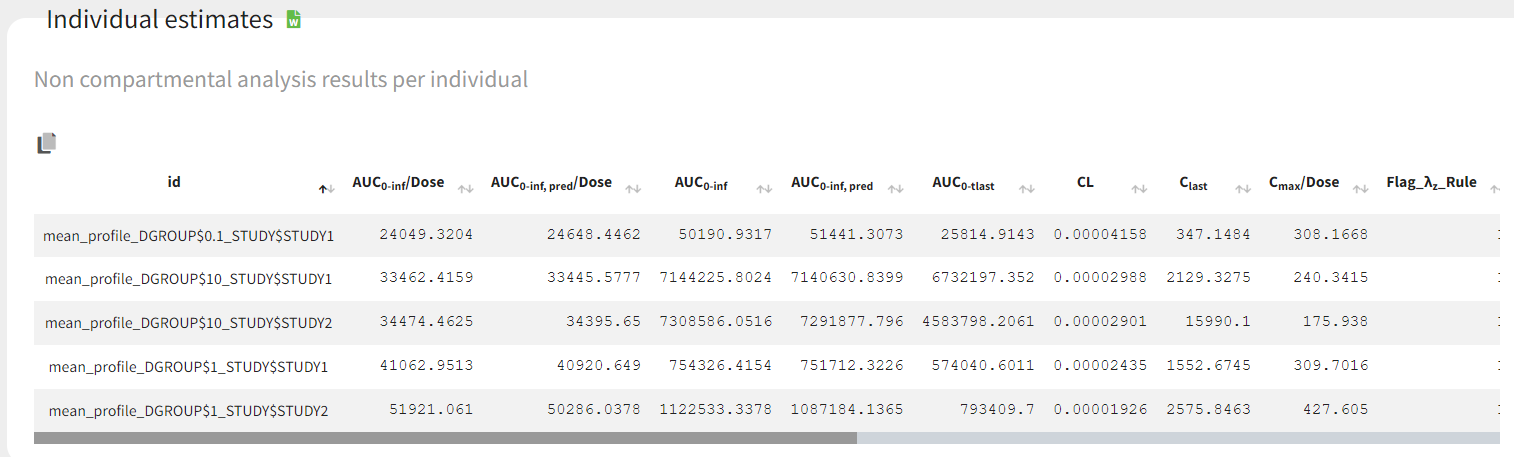
The parameters calculated on the mean profiles appear in the table of individual NCA parameters and the NCA summary table.
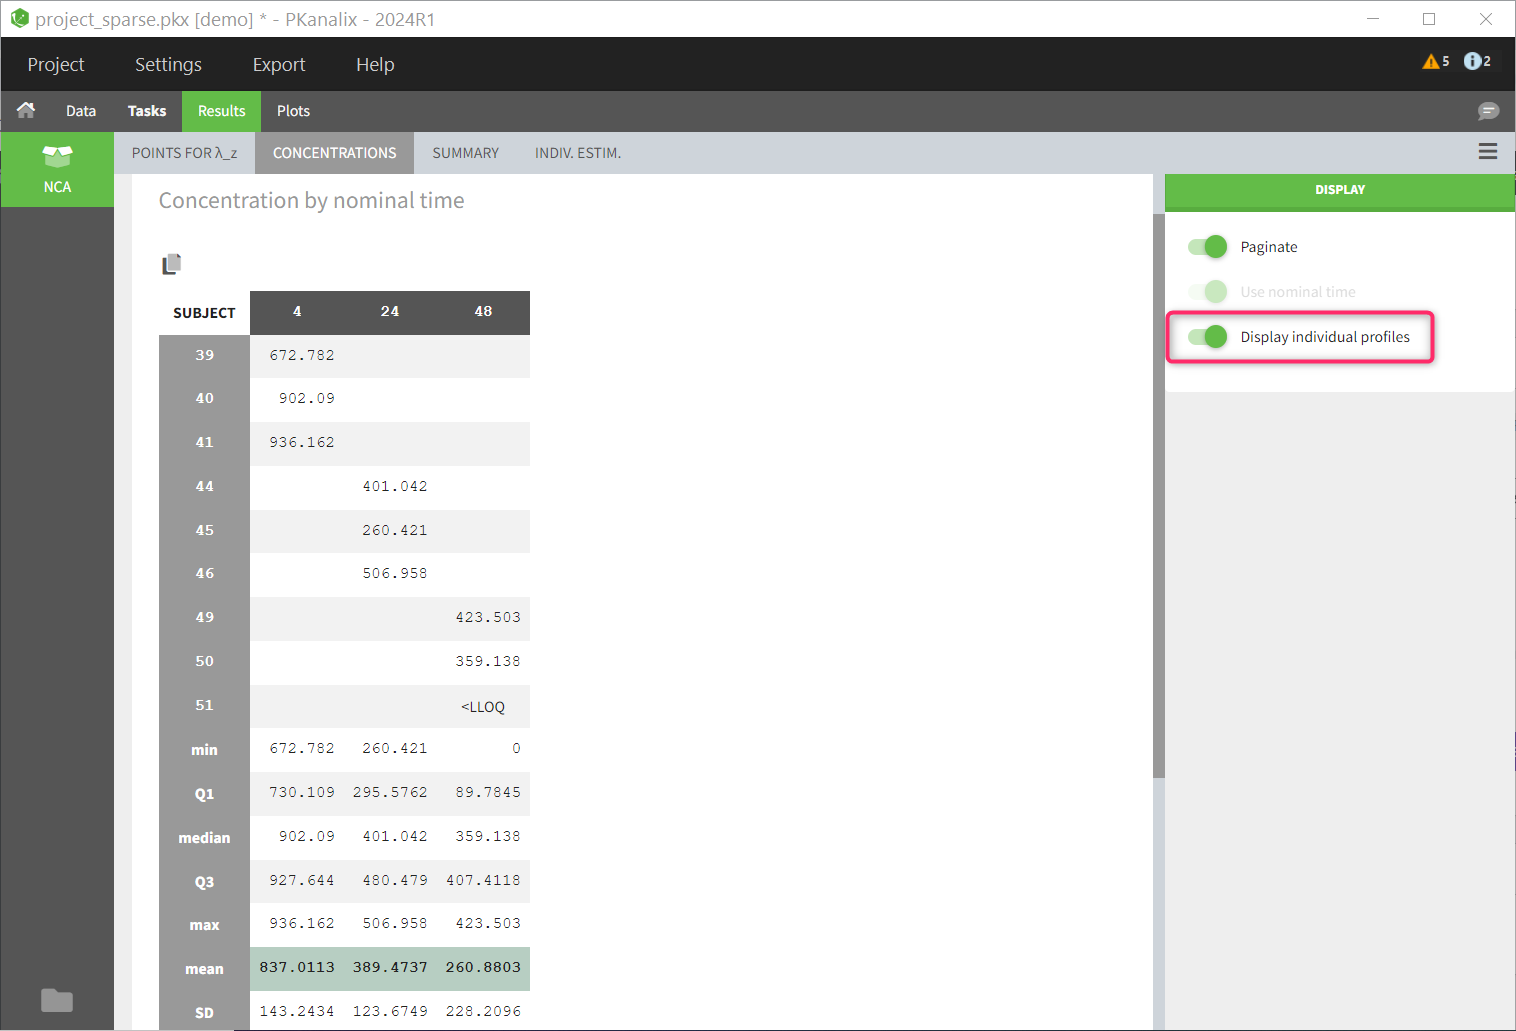
The table of concentrations displays both the individual concentration data, and the mean profiles on the “mean” rows. The table is stratified by the covariates selected for sparse data.
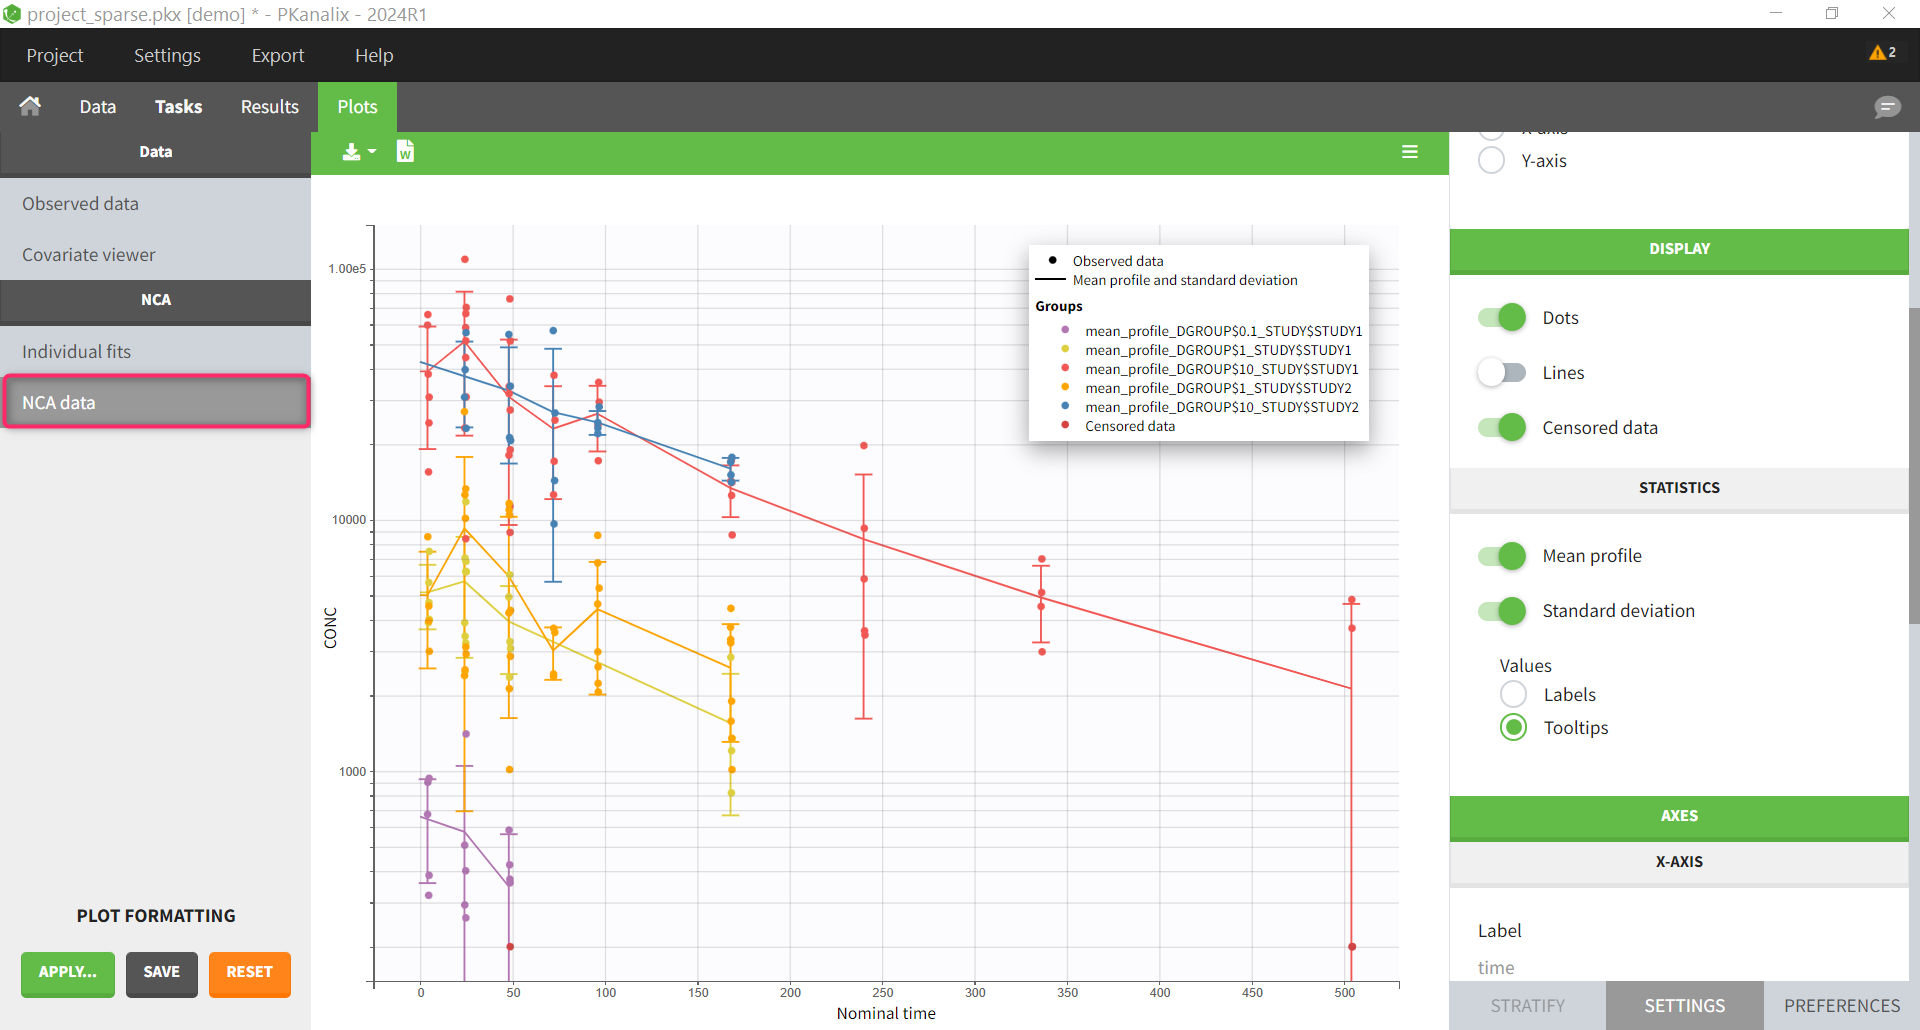
The NCA data plot is a new plot that shows the mean profiles and the individual data points on the same plot, with different colors for the different mean profiles.
The NCA individual fits plot shows the mean profiles and the NCA parameters calculated from them. The other NCA plots are disabled because they are not relevant for sparse data analysis.