Subject-by-formulation
Purpose
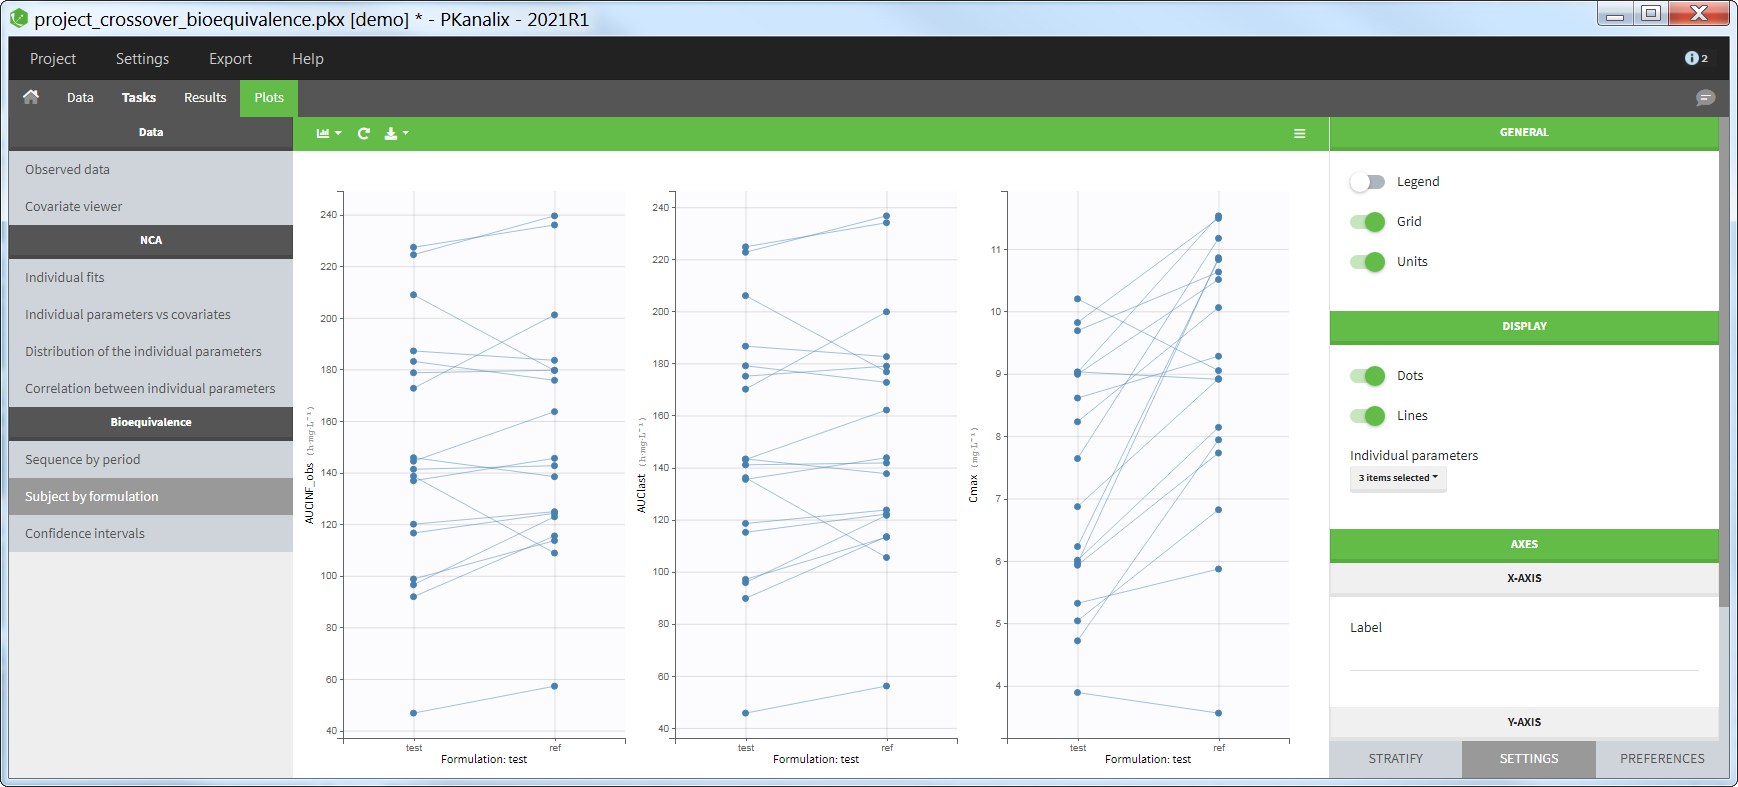
This plot allows to visualize, for each parameter, the subject-by-formulation interaction and the inter-subject variability.
Description
Each subplot corresponds to one NCA parameter and one non-reference (test) formulation. The individual parameter values for the test and reference formulations are displayed side by side. Values corresponding to the same individual are connected by a line. When an individual has received several times the same formulation (repeated crossover), the average for each formulation is calculated and plotted.

Settings
General
Legend: hide/show the legend. The legends adapts automatically to the elements displayed on the plot. The same legend box applies to all subplots and it is possible to drag and drop the legend at the desired place.
Grid : hide/show the grid in the background of the plots.
Units: hide/show the units of the NCA parameters. Note that the color and surrounding character can be chosen in the plot “Preferences”.
Display
Dots: hide/show the dots representing the individual parameter values
Lines: hide/show the lines connecting the dots belonging to the same individual
Individual parameters: select which individual parameters to show on the plot
Stratify
The plot can split and filtered but not (yet) colored.
