Tagging a data set
Column tagging
After loading a formatted data set directly, or previewing a data set that has gone through data formatting, users need to assign meaning to different columns of the formatted data set.
This is done in the Data tab by clicking on the dropdown menus above each of the column headers:
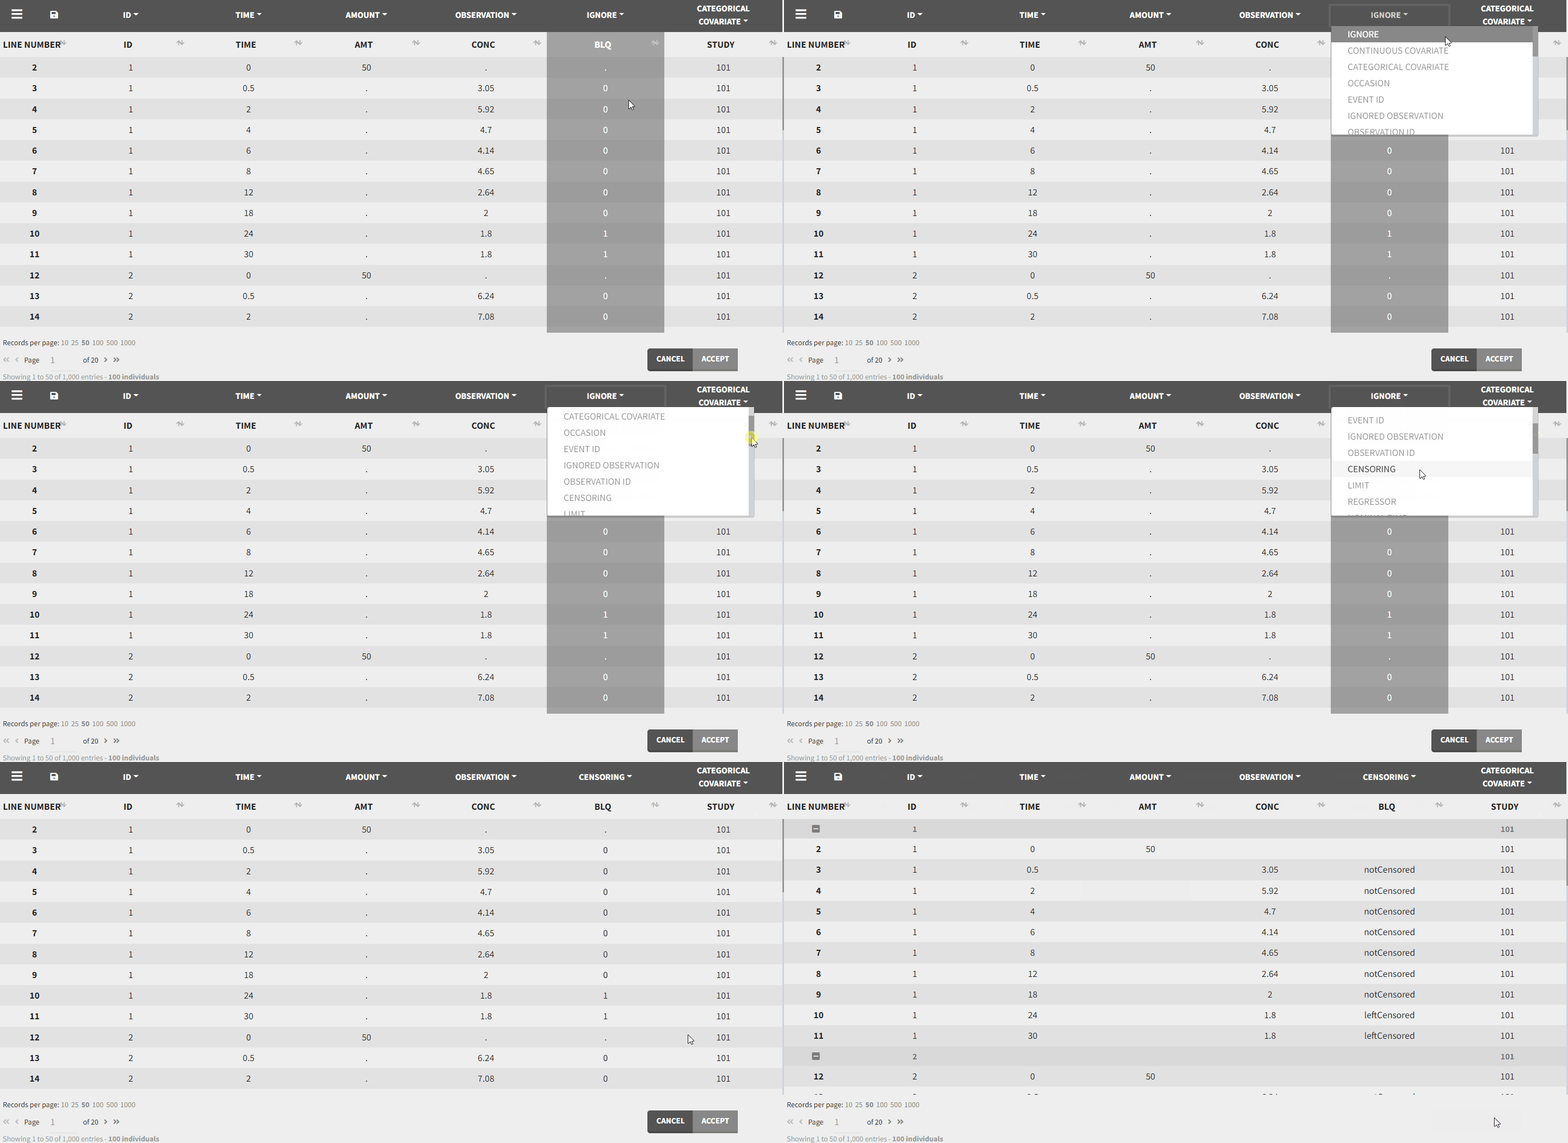
After tagging the columns and accepting the data set, the interpreted data set is shown. The interpreted data set may be different from original data set, as it shows a data set after data formatting and filtering steps were applied. It also includes doses added through the ADDL column and steady state settings, additional covariates, interpolated values of regressors, censoring information as strings, …
The information about the meaning of each of the dropdown option can be found on these pages:
Automatic column tagging
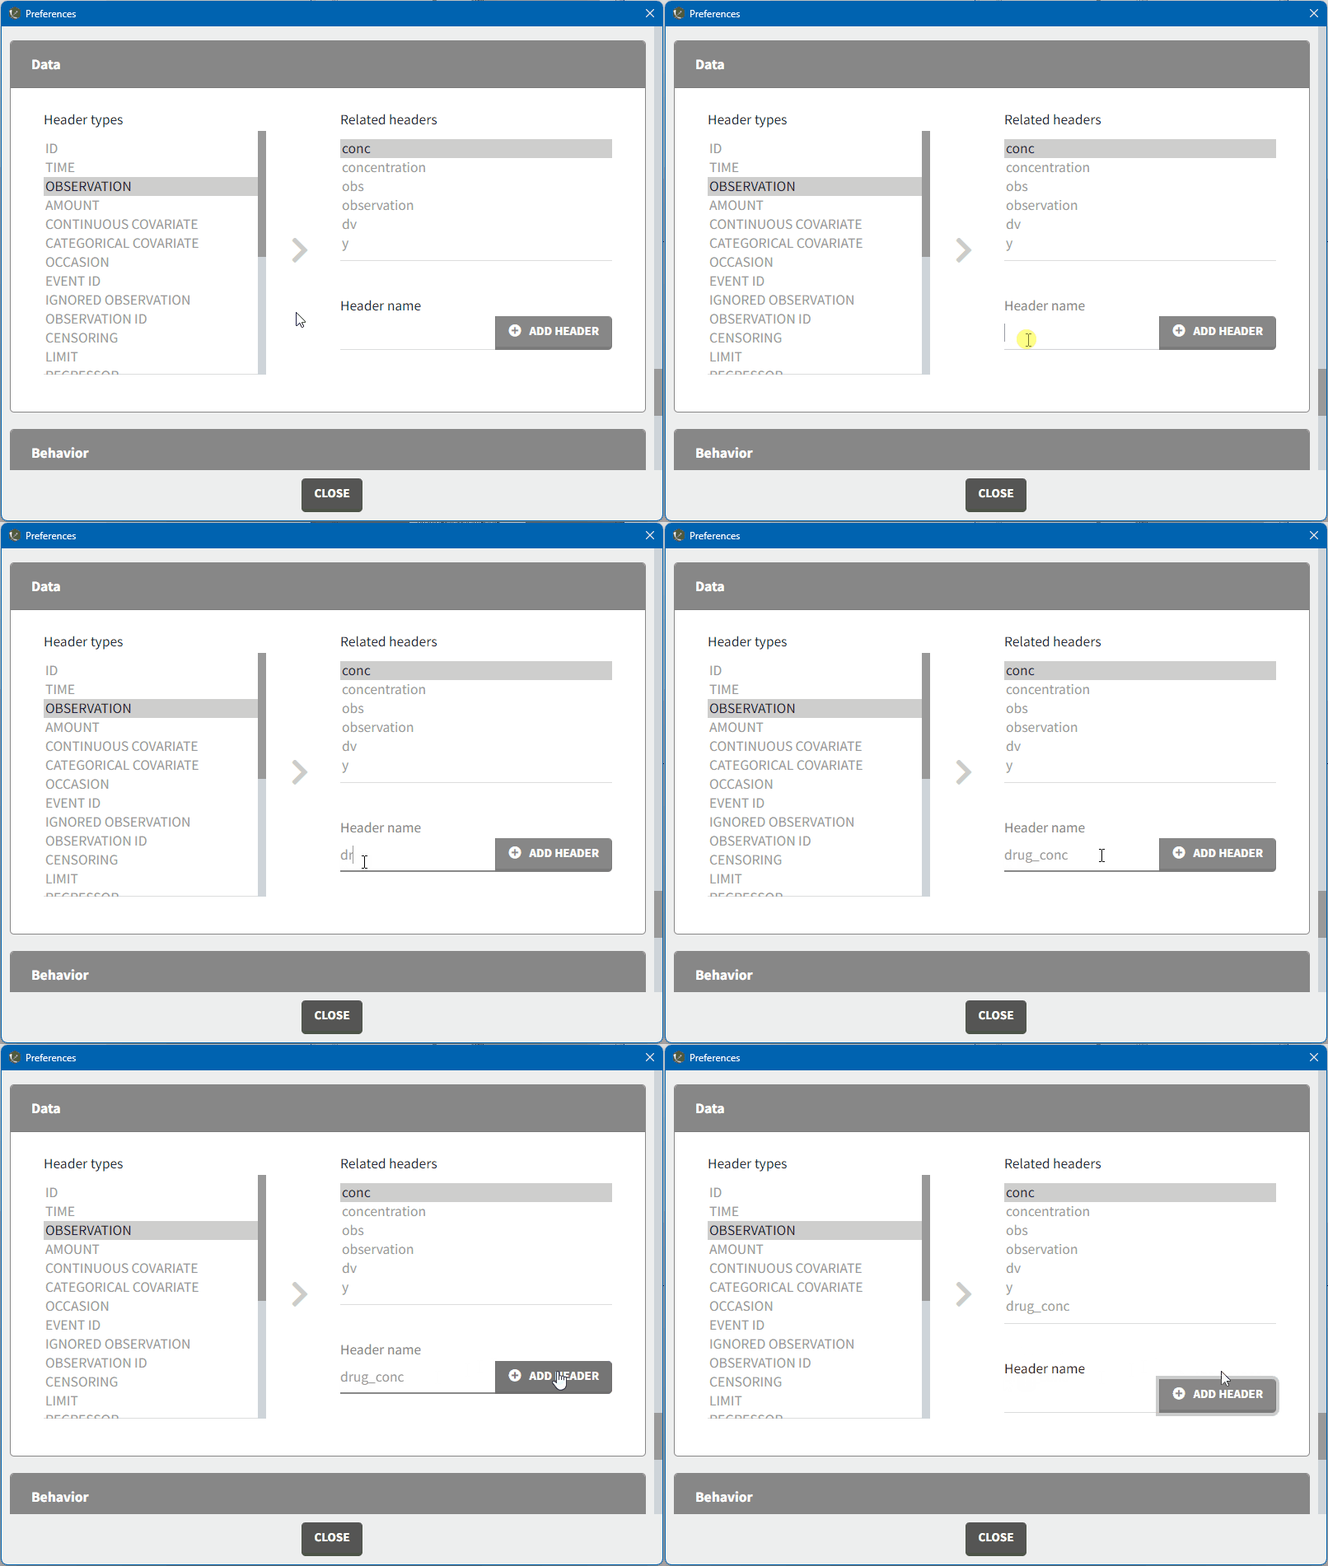
MonolixSuite applications automatically suggest column types based on the headers in the data, which can be customized in the preferences. Clicking on Settings>Preferences, displays the following window where mapped headers can be added or removed.
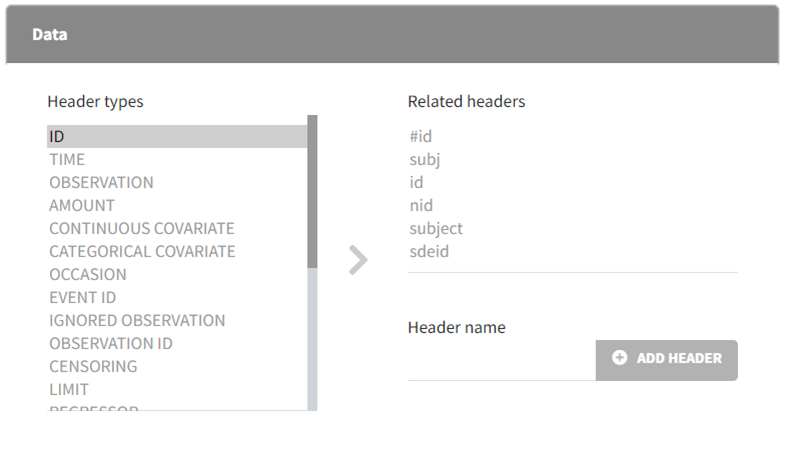
In the Data section, you can add or remove preferences for each column.
To remove a mapping, double-click on the preference you would like to remove. A confirmation window will appear.
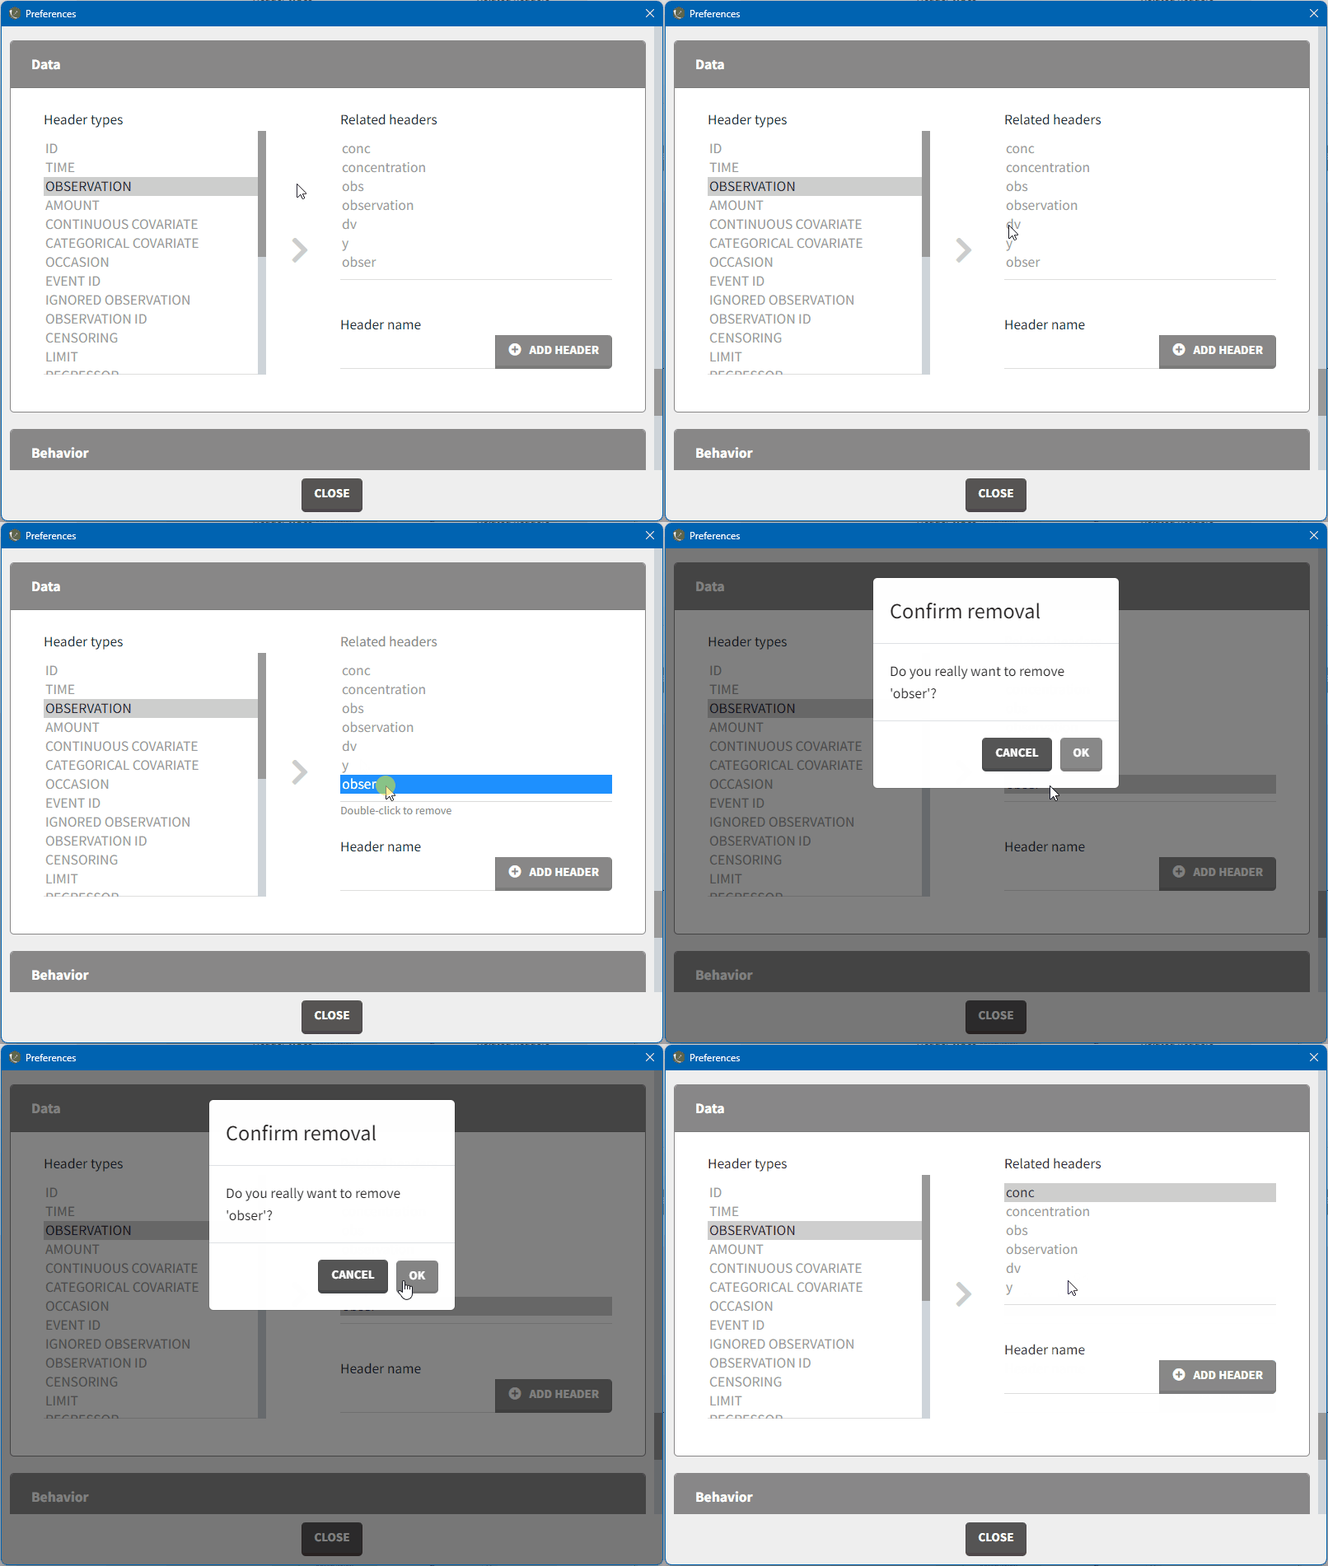
To add a mapping, click on the header type you want to use, add a column name in the ‘header name’ field and click on “ADD HEADER” as shown here.
Note that the header mapping preferences are shared between Monolix and PKanalix.
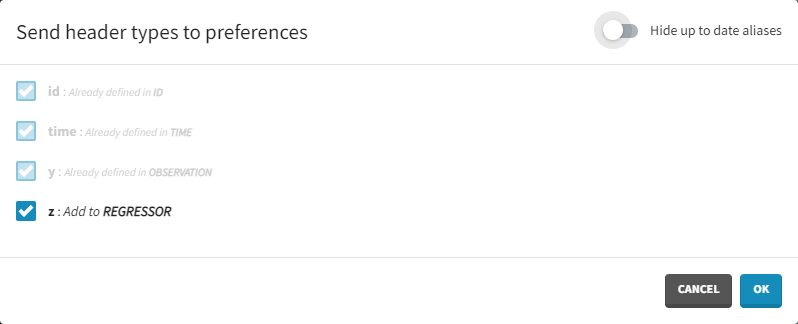
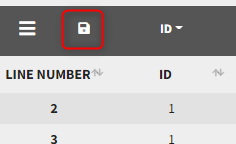
Starting with version 2024, the preferences can be updated with the columns tagged in the current project by clicking on the icon in the top left corner of the data table:
This will open a window with the option to choose which of the tagged headers to add to preferences:
