
Purpose
This plot displays scatter plots for each pair of parameters. It allows to identify correlations between parameters, which can be used to see the results of your analysis and see the coherence of the parameters for each individuals.
Example
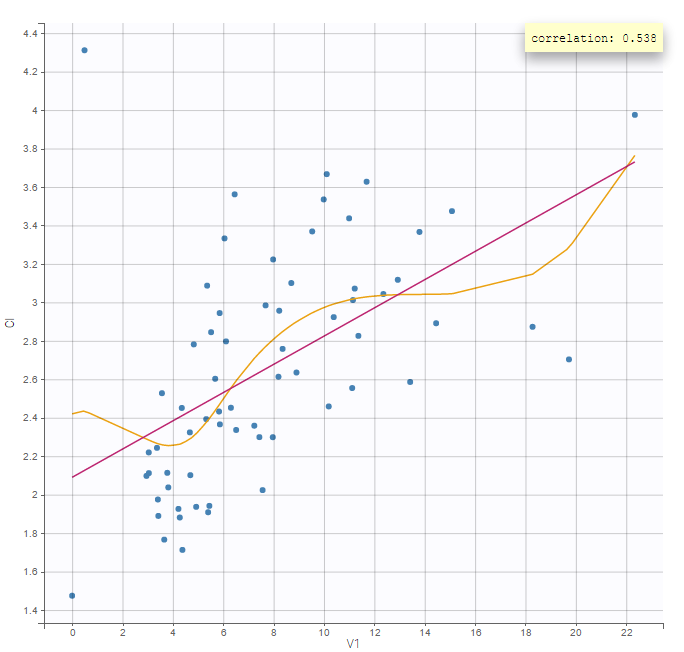
In the following example, one can see pairs of parameters estimated for all parameters.

Visual guidelines
In addition to regression lines, correlation coefficients can been added to see the correlation between random effects, as well as spline interpolations.
Selection
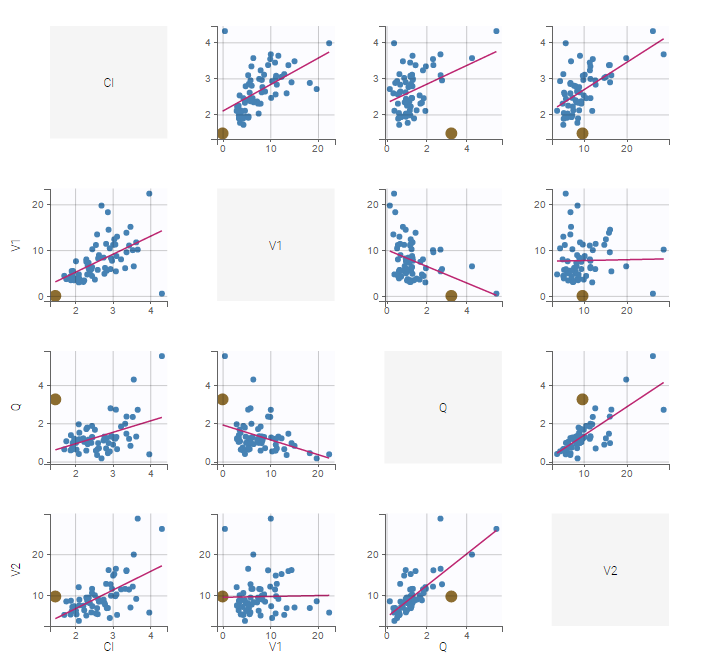
It is possible to select a subset of parameters, whose pairs of correlations are then displayed, as shown below. In the selection panel, a set of contiguous rows can be selected with a single extended click, or a set of non-contiguous rows can be selected with several clicks while holding the Ctrl key.
Highlight
Similarly to other plots, hovering on a point provides information on the corresponding subject id, and highlights other points corresponding to the same individual.
Stratification: coloring and filtering
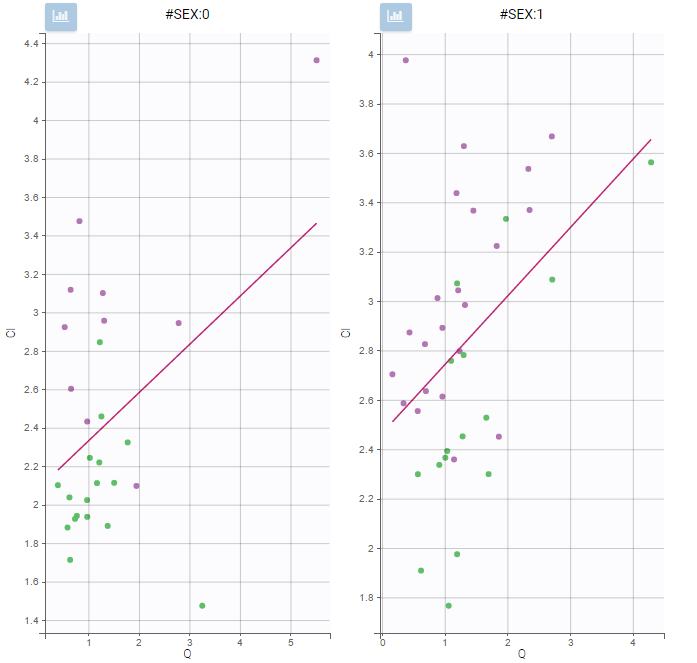
Stratification can be applied by creating groups of covariate values. As can be seen below, these groups can then be split, colored and/or filtered allowing to check the effect of the covariate on the correlation between two parameters. The correlation coefficient is updated according to the stratifying action. In the following case, We split by the covariate SEX and color bay 2 categories of AGE.
Settings
-
General
-
Legend and grid : add/remove the legend or the grid. There is only one legend for all plots.
-
Information: display/hide the correlation coefficient associated with each scatter plot.
-
-
Display
-
Selection. The user can select some of the parameters to display only the corresponding scatter plots. A simple click selects one parameter, whereas multiple clicks while holding the Ctrl key selects a set of parameters.
-
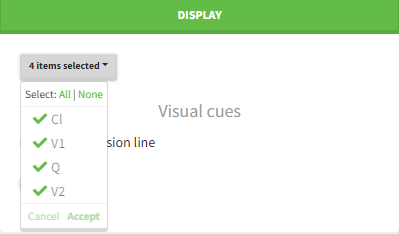
Visual cues. Add/remove the regression line or the spline interpolation.
-