Turns a data frame into a flextable ready for reporting, formatted for Word, PowerPoint and HTML output. It applies a theme, conditional cell colouring, subscript rendering, custom title lines and manual footnotes. These core formatting features are independent of MonolixSuite and apply to any data frame.
Some features are driven by attributes that the package's table* / listing* helpers attach to their output (for PKanalix or Monolix projects): automatic table section headers and automatic footnotes (for example the project and R script source, or observations excluded by NCA time deviation filtering). For a data frame that does not carry these attributes, the corresponding arguments, autoFootnote and the automatic sectioning, have no effect, while all other arguments apply.
Usage
styleTFL(data,
         groupingColumns = NULL,
         headerLines     = NULL,
         colorBy         = NULL,
         themeFn         = flextable::theme_booktabs,
         softenAmount    = 0.50,
         htmlAlpha       = 0.18,
         alignDefault    = "center",
         alignGrouping   = NULL,
         alignCols       = NULL,
         footnote        = NULL,
         autoFootnote    = TRUE,
         autoHighlight   = FALSE)
Arguments
-
-
data(data.frame) Data frame to format as a flextable. Output of thetable*andlisting*helpers is recognised through its attributes (table_type,format) and aSectioncolumn, which drive automatic section headers.[[sub:text]]markers in cell values or column names are rendered as subscripts. A plain data frame without these attributes is fully supported. -
groupingColumns(character vector) Column names moved to the front of the table, grouped to the left and vertically merged. IfNULL(default), no reordering or merging is applied. -
headerLines(character vector) Title lines placed above the column header. The first element is the topmost line, and any number of lines is allowed. IfNULL(default), no title lines are added. -
colorBy(character vector) One or more conditional coloring rules to apply. This selects a rule, it is not a colour value. Case insensitive. IfNULL(default), no colouring is applied. Available rules:-
"RSE": any column whose name contains "RSE". 50 to 100 yellow, 100 to 200 orange, above 200 red. -
"PVAL": thep.valuecolumn. At most 0.01 red, 0.01 to 0.05 orange, 0.05 to 0.09 yellow. -
"BE": theConclusioncolumn for bioequivalence. "Bioequivalent" green, "Not bioequivalent" red. -
"DP": theConclusioncolumn for dose proportionality. "Proportional" green, "Inconclusive" yellow, "Not Proportional" red.
-
-
themeFn(function) flextable theme function applied to the table. Default isflextable::theme_booktabs. Other options includeflextable::theme_vanilla,flextable::theme_zebra,flextable::theme_boxandflextable::theme_tron, or a custom theme function. -
softenAmount(numeric) Value between 0 and 1 controlling how far cell colours are blended toward white for Word and PowerPoint output, where 0 keeps the full colour and 1 is white. Default is 0.50. Applies only to Word and PowerPoint output. -
htmlAlpha(numeric) Value between 0 and 1 controlling the opacity of the rgba cell colours used for HTML output. Default is 0.18. Applies only to HTML output. -
alignDefault(character) Global text alignment for the body and the column name header row. One of"left","center"(default),"right"or"justify". Title lines added throughheaderLinesare always centered. -
alignGrouping(character) Text alignment for the grouping columns, applied to the body and the column name header row. IfNULL(default), the grouping columns usealignDefault. -
alignCols(named character vector) Per column alignment, for examplec(Estimate = "right", RSE = "center"). OverridesalignDefaultandalignGroupingfor the named columns. IfNULL(default), no column specific alignment is applied. -
footnote(character vector) Manual footnote text added below the table. IfNULL(default), no manual footnote is added. -
autoFootnote(logical) IfTRUE(default), footnotes are generated automatically from the data attributes attached by thetable*andlisting*helpers, such as the project and R script source, or observations excluded by NCA time deviation filtering. Has no effect when these attributes are absent. -
autoHighlight(logical) IfTRUE, the best model chosen at each step of a covariate model building table is shaded and an explanatory footnote is added. Requires thebest_per_stepattribute set bytableCovariateModelBuilding(). Default isFALSE.
-
Examples
Population parameter estimate table with color coded RSEs
initializeLixoftConnectors(path.software, software = "monolix")
loadProject(paste0(getDemoPath(),"/1.creating_and_using_models/1.1.libraries_of_models/warfarinPKPD_project.mlxtran"))
runScenario()
poptable <- tablePopulationParameterEstimates(
  customAliases = c(
    Tlag_pop   = "T[[sub:lag]]",  ka_pop     = "k[[sub:a]]",    V_pop     = "V",            Cl_pop     = "lL",
    R0_pop     = "R[[sub:0]]",    IC50_pop   = "IC[[sub:50]]",  kout_pop  = "k[[sub:out]]", Imax_pop   = "I[[sub:max]]",
    omega_Tlag = "ω[[sub:Tlag]]", omega_ka   = "ω[[sub:ka]]",   omega_V   = "ω[[sub:V]]",   omega_Cl   = "ω[[sub:Cl]]",
    omega_IC50 = "ω[[sub:IC50]]", omega_kout = "ω[[sub:kout]]", omega_R0  = "ω[[sub:R0]]",  omega_Imax = "ω[[sub:Imax]]"),

  customUnits = c(Tlag_pop = "h",    ka_pop = "1/h", V_pop    = "L",   Cl_pop   = "L/h",
                  IC50_pop = "mg/L", R0_pop = "%",   kout_pop = "1/h", Imax_pop = "%")
)
styleTFL(poptable, colorBy = "RSE")
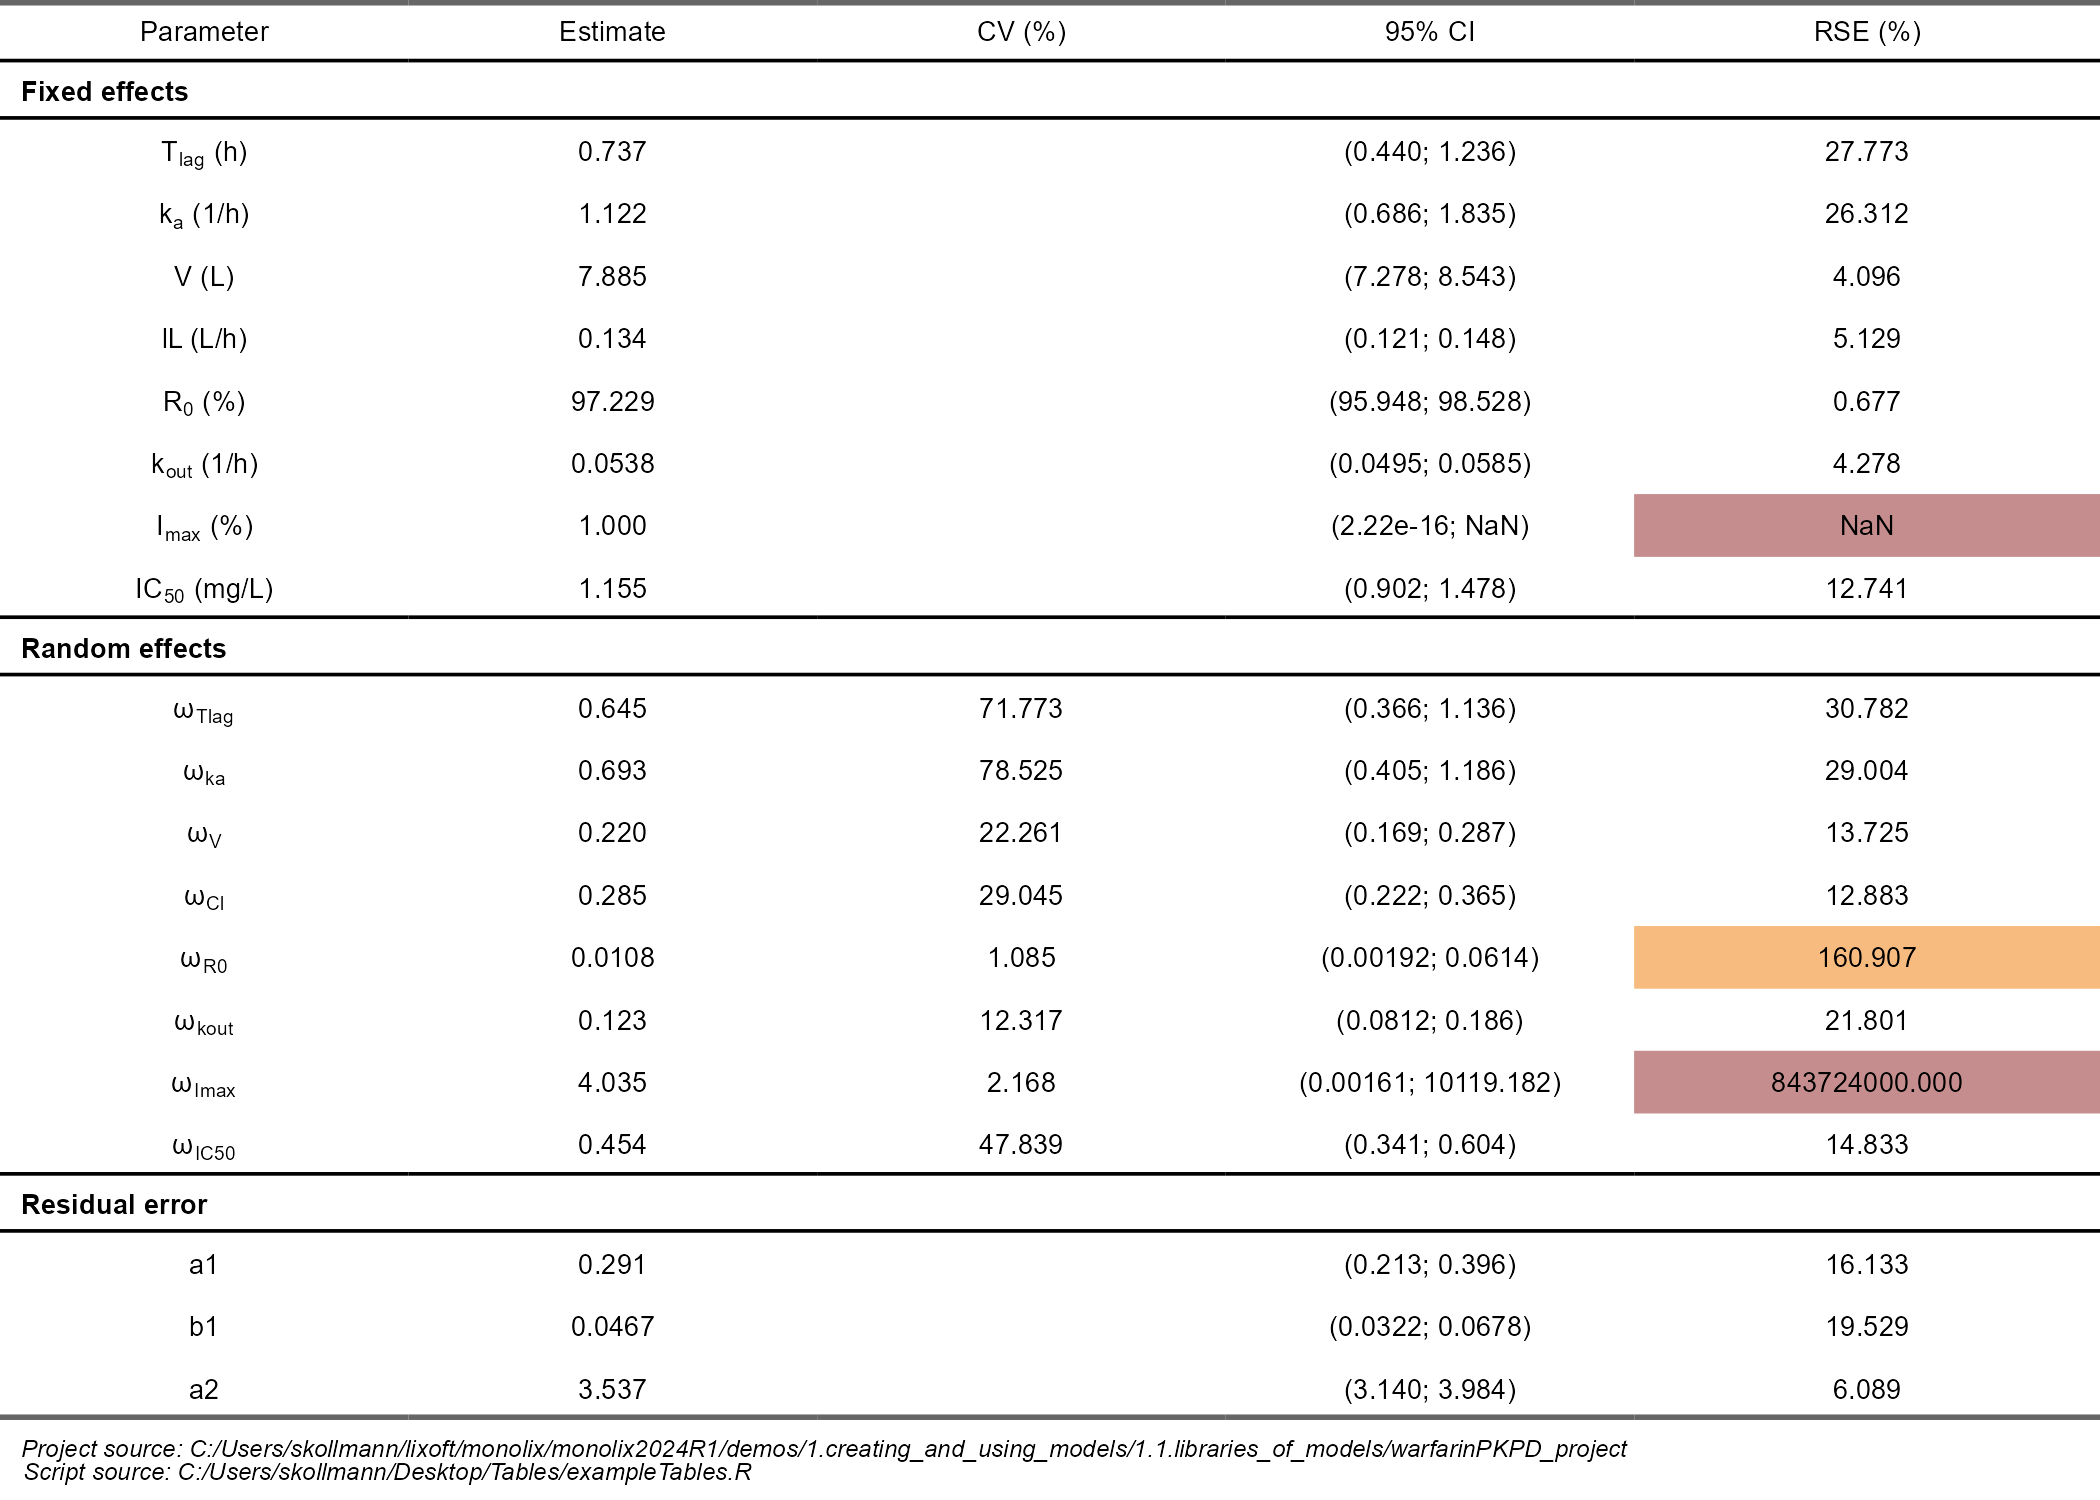
styleTFL() automatically:
-
Inserts section-divider rows to separate different sets of parameters, e.g. for population-parameter tables, it adds Fixed effects, Fixed effects by category, Random effects (IIV/IOV), Correlations, and Residual error headers, derived from the table's
Sectionattribute, so related parameters are visually grouped. -
Adds a source footnote (when
autoFootnote = TRUE, the default) citing the originating Monolix/PKanalix project and the R script the table was generated from, read from the table'sproject_sourceandr_sourceattributes. -
Renders the subscript markup
[[sub:…]]as true subscripts, e.g.k[[sub:a]]is displayed as kₐ andIC[[sub:50]]as IC₅₀.
NCA Concentration summary table grouped by covariate
initializeLixoftConnectors(path.software, software = "pkanalix")
loadProject(paste0(getDemoPath(), "/1.basic_examples/project_nominal_time.pkx"))
runNCAEstimation()

NCAConc <- tableNCAConcentration(
  useNominalTime   = TRUE,
  splitCovariates  = "SEX",
  filterCovariates = list(SEX = "M"),
  includeIds       = TRUE,
  metrics          = c("N", "min", "MeanSD", "GeomCV", "max"),
  maxTimeDeviation = 15
  )
styleTFL(NCAConc, groupingColumns = "SEX")
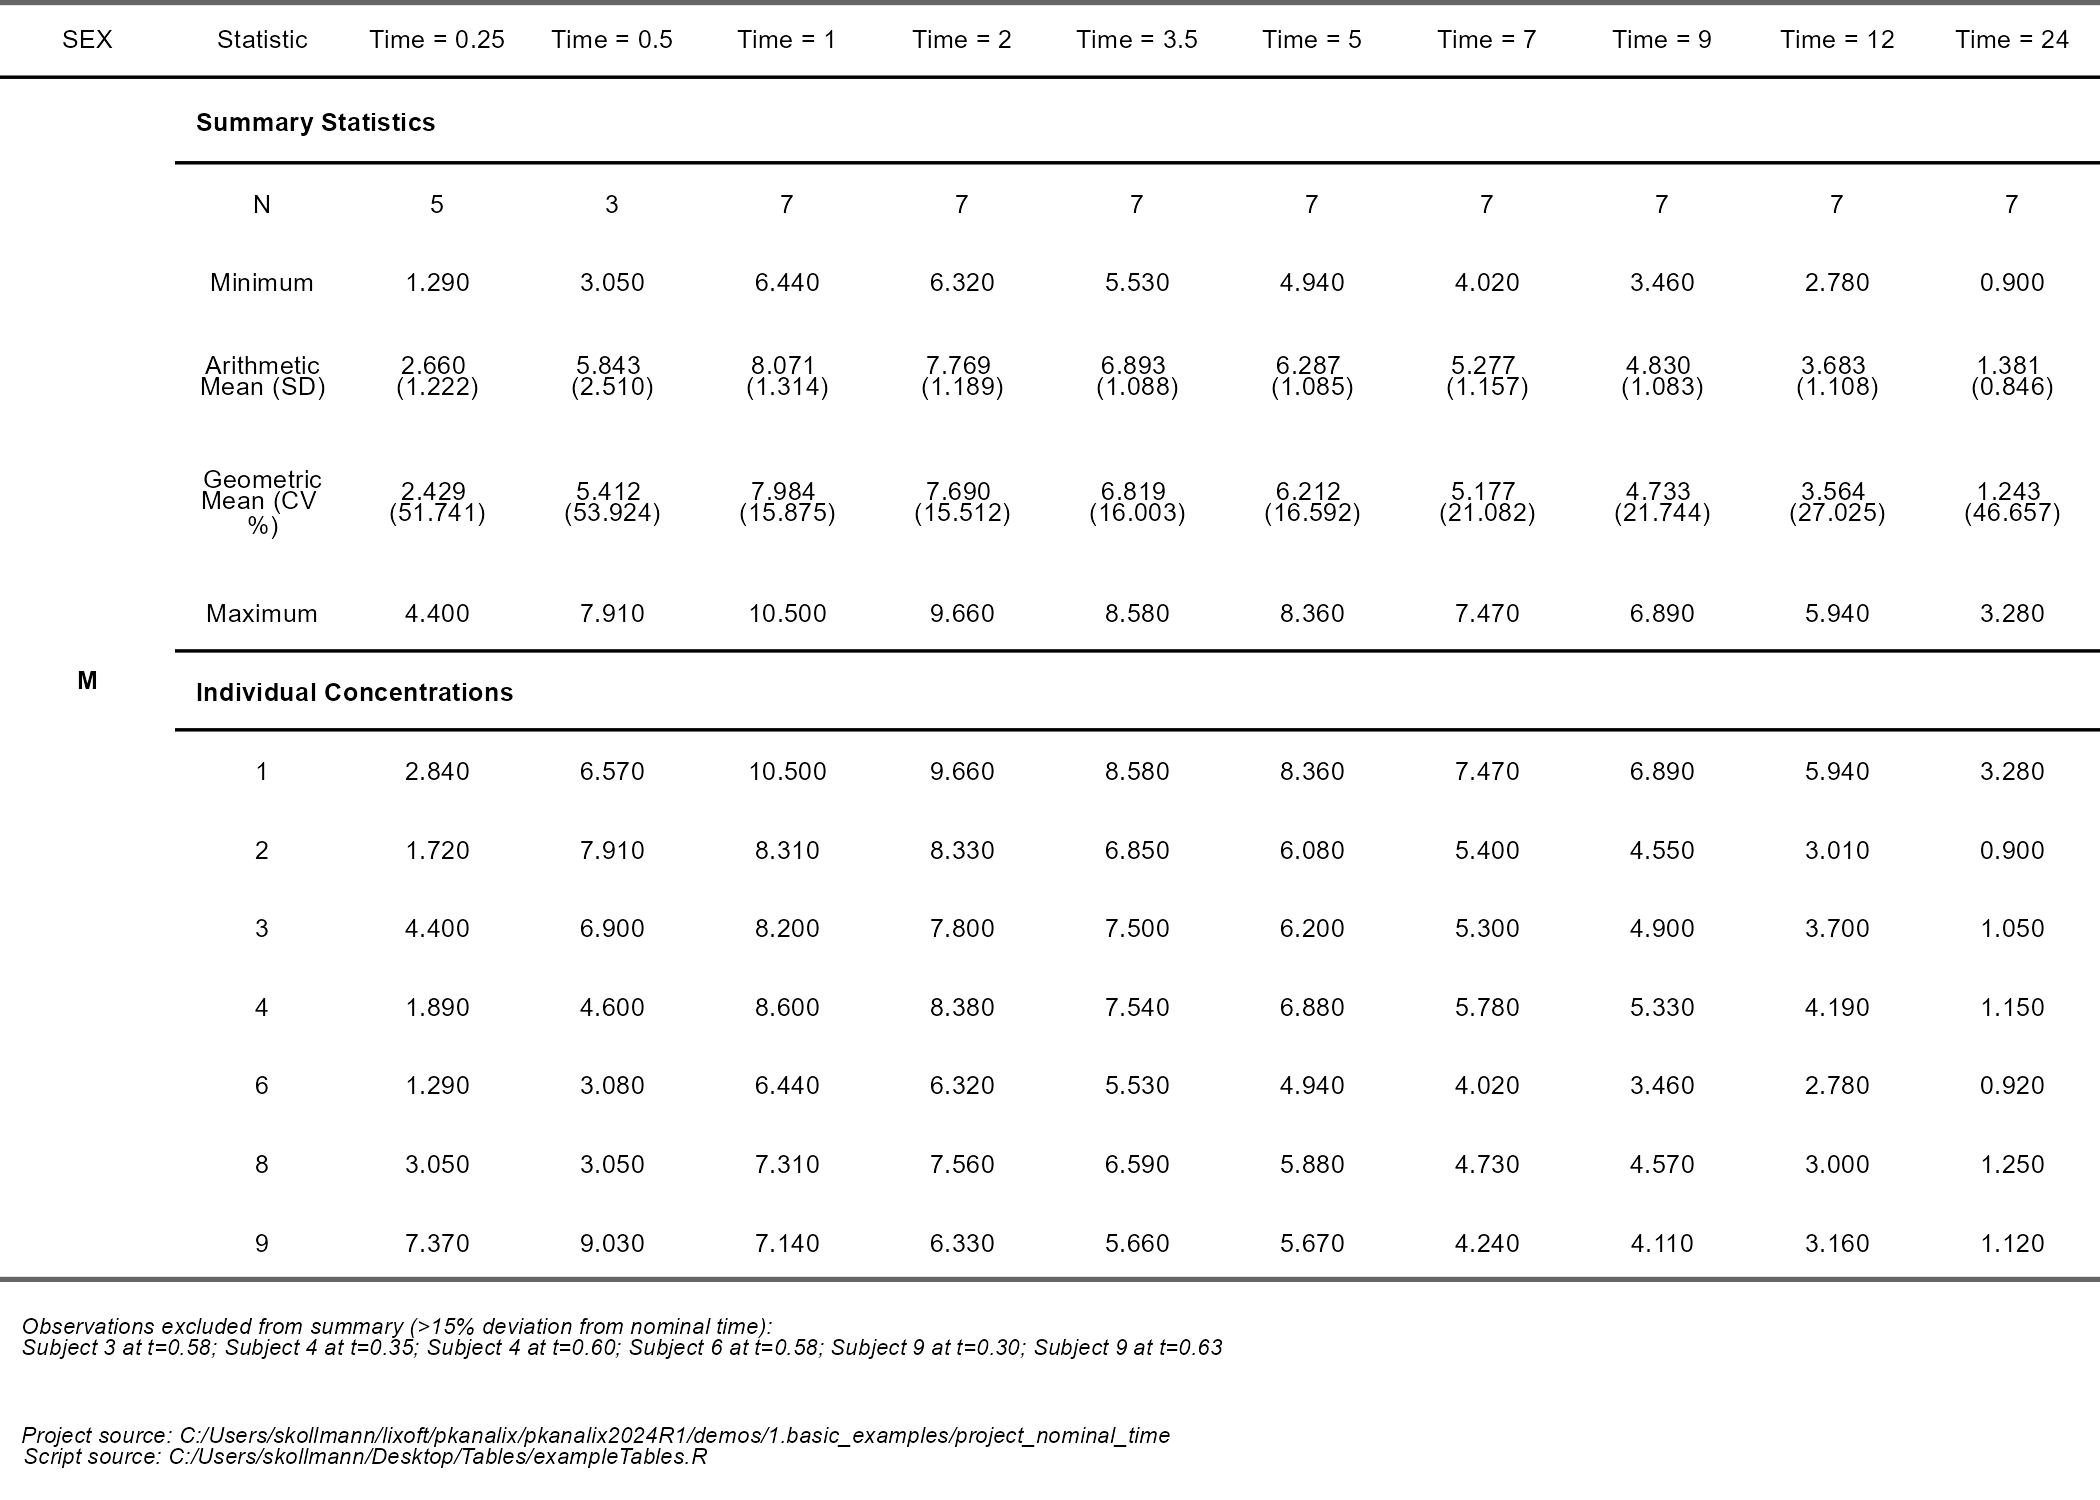
styleTFL() automatically:
-
Adds data-driven footnotes when a maximum time-deviation threshold is set and observations are dropped from an NCA summary, it reports each excluded subject (with occasion, when present) and its actual time point in a footnote, e.g. "Observations excluded from summary (>15% deviation from nominal time): Subject 5 at t=2.13; …".
-
Inserts section-divider rows in NCA tables, a Summary Statistics header above the summary rows and an Individual Concentrations header above the individual concentration rows (or Individual Parameters / Individual Ratios for the corresponding tables), so the pooled summary and the per-subject data are visually separated.
Dosing regimen listing with custom title Lines & theme
initializeLixoftConnectors(path.software, software = "pkanalix")
loadProject(paste0(getDemoPath(),"/2.case_studies/project_Theo_extravasc_SS.pkx"))

dosing <- listingDosingRegimen(
  splitCovariates      = c("SEQ", "FORM"),
  splitCovariateLabels = c("Sequence", "Formulation"),
  filterCovariates     = list(SEQ = "TR"),
  filterIds            = c(1, 2)
)

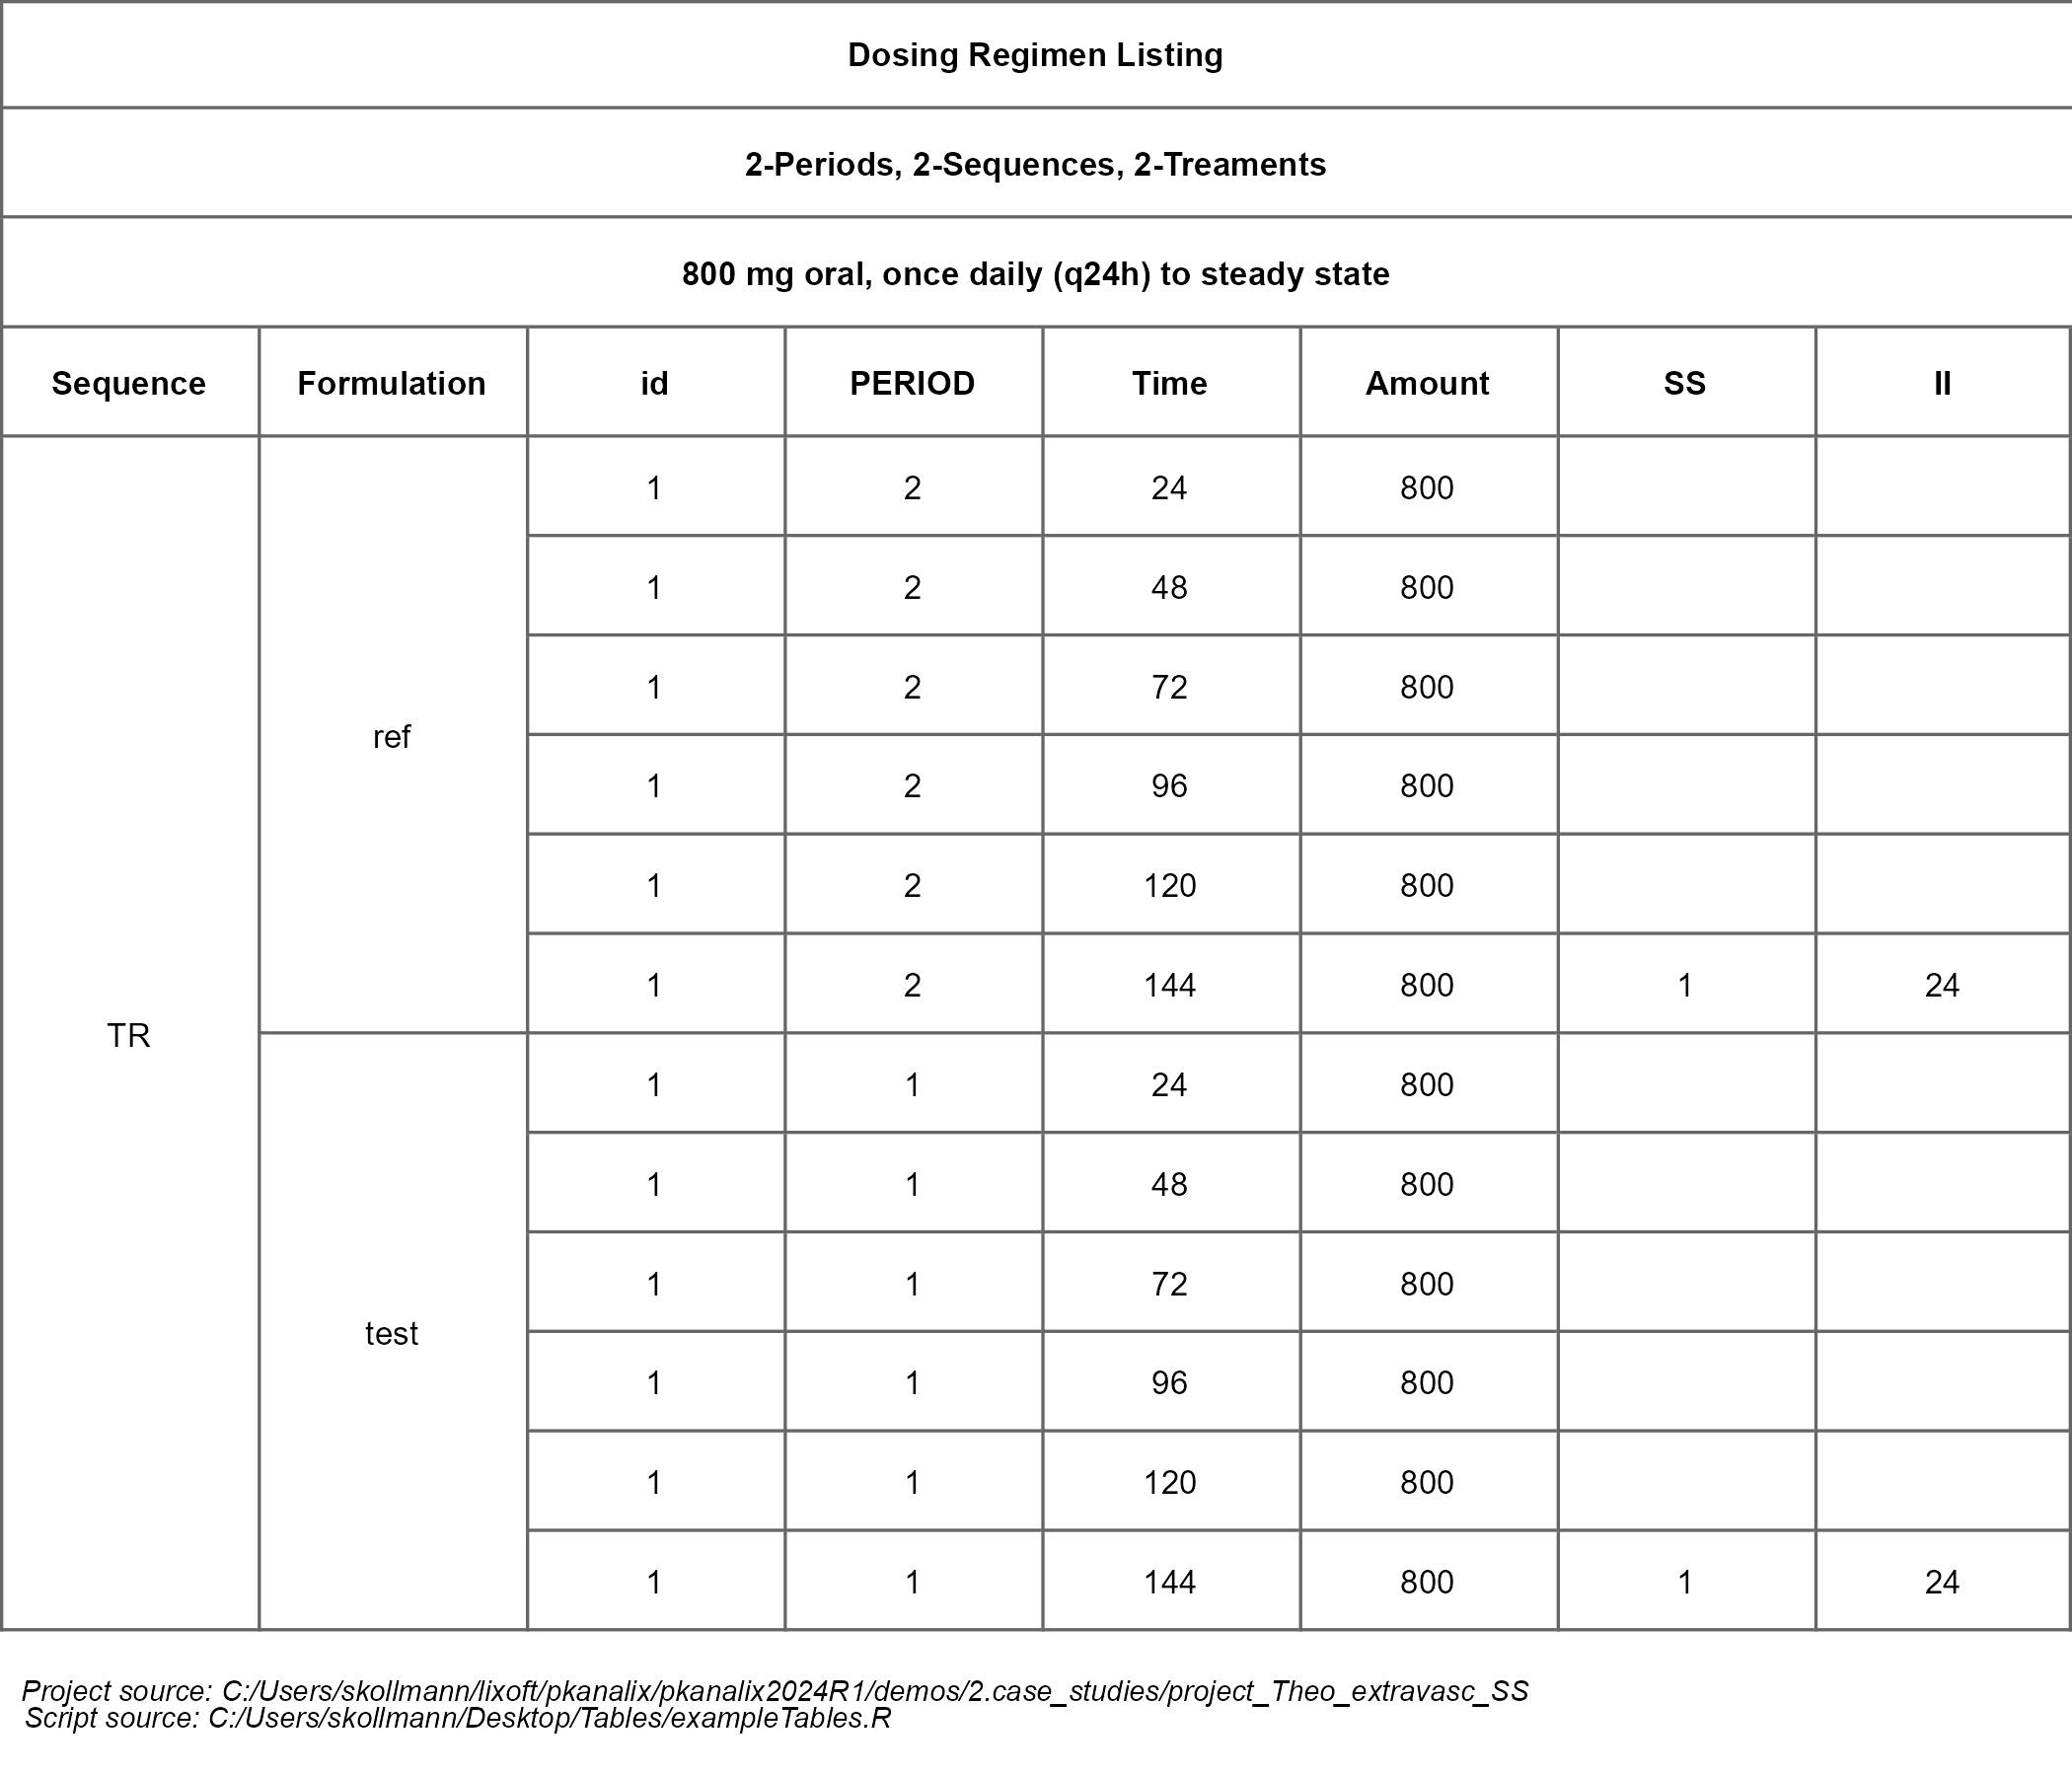
styleTFL(dosing,
         themeFn         = theme_box,
         groupingColumns = c("Sequence","Formulation"),
         headerLines     = c("Dosing Regimen Listing",
                              "2-Periods, 2-Sequences, 2-Treaments",
                              "800 mg oral, once daily (q24h) to steady state")
        )
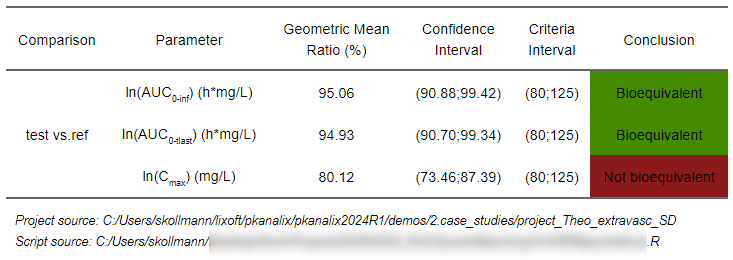
Bioequivalence results table with grouped comparison column and color coded conclusion column
initializeLixoftConnectors(path.software, software = "pkanalix")
loadProject(paste0(getDemoPath(),"/2.case_studies/project_Theo_extravasc_SD.pkx"))
runNCAEstimation()
runBioequivalenceEstimation()

be <- tableBEResults(
  BELimits    = TRUE,
  roundDigits = 2
  )

styleTFL(be,
         groupingColumns = "Comparison",
         colorBy         = "BE",
         softenAmount    = 0.0,
         htmlAlpha       = 0.80)