Introduction to TMDD concepts
The concept of TMDD has been proposed as an explanation to the non-linear behavior (violation of the superposition principle and dose-dependent volume of distribution) displayed by some drugs such as bosentan. The concept was first formulated by Gerhard Levy in
Levy describes the TMDD in the following way: “a considerably larger fraction of the dose of these high-affinity compounds is bound to target sites, enough so that this interaction is reflected in the pharmacokinetic characteristics of the drug.”
Target-mediated drug disposition happens when the binding of the drug to the target influences the drugs distribution and elimination. This is in particular often the case for biologics (see section Examples of molecules), such as monoclonal antibodies for instance (for a review, see for instance Dostalek et al. (2013)), because they are designed to be highly specific and strongly bind to their target. In this case, the drug is eliminated both via usual linear clearance mechanisms, that dominate at high concentrations when the target is saturated, and non-linear target-mediated clearance (via binding and internalization of the drug-target complex), that is mainly visible at low concentrations.
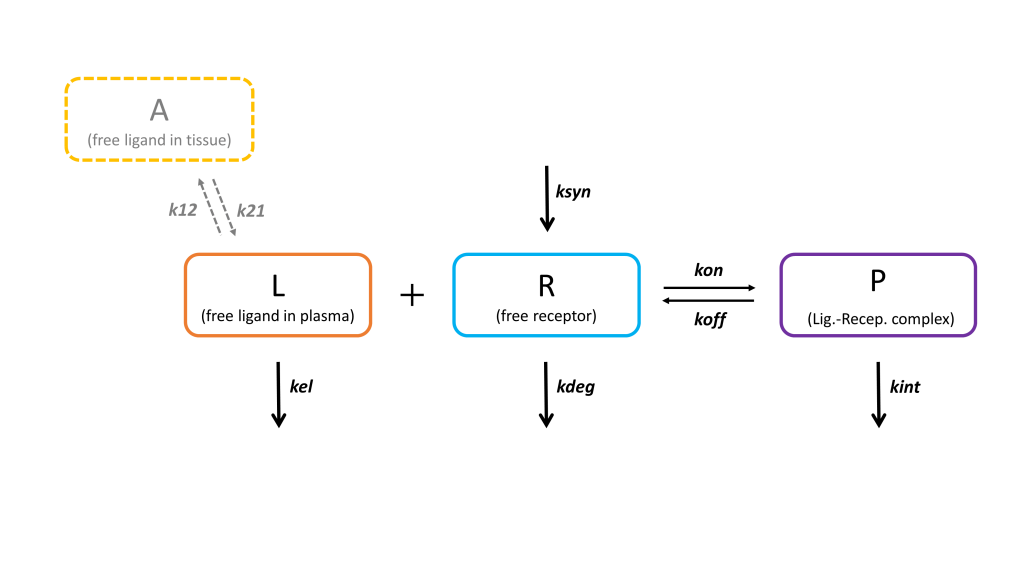
The interplay of these mechanisms results in complex concentration-time curves. To describe the observed data, Mager and Jusko ((2001) JPP 28(6)) have introduced a set of equations that includes:
the linear elimination of the ligand (elimination rate kel)
the turnover of the receptor (synthesis rate ksyn, degradation rate kdeg, initial receptor concentration R0=ksyn/kdeg)
the binding of the ligand to the receptor to form the complex (binding rate kon, dissociation rate koff, dissociation constant KD=koff/kon)
the internalization of the complex (rate kint)
(optional) the distribution of the ligand to a peripheral compartment (rates k12 and k21)

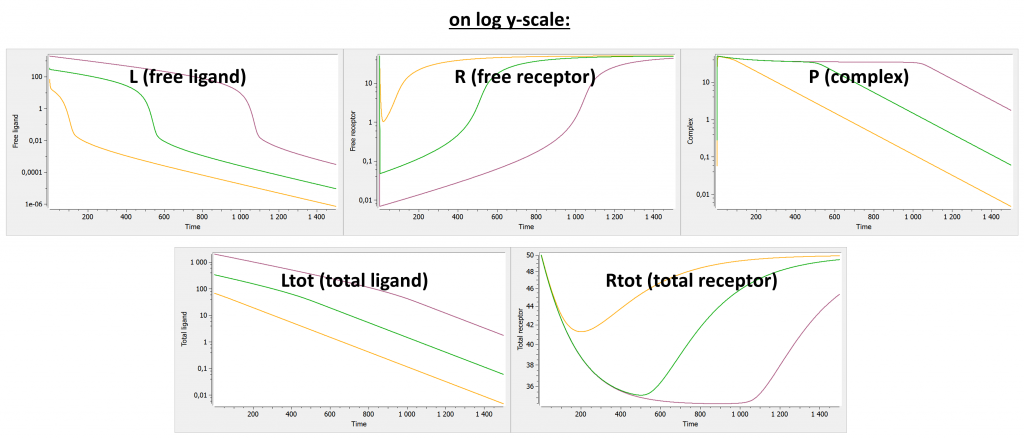
A key characteristic of TMDD systems is that the pharmacokinetic behavior depends on the dose. Let us focus on the free ligand concentration-time course with several doses of different magnitudes. In the figure below, we look at the concentration (on log-scale) with respect to time. In addition, we use a bolus administration and a single compartment for the ligand (the two compartment case will be studied later on).

As can be seen on the green curve, when the initial concentration of ligand is larger than the initial receptor concentration (here R0=100), the ligand concentration-time curve displays a complex shape (see also Peletier et al. (2012)) with:
Phase 1: steep initial decrease, corresponding to the rapid binding of the ligand to the receptor.
Phase 2: linear elimination phase, where the receptor is saturated with ligands (almost no more binding of ligand to receptor happens), and the ligand is eliminated via usual elimination processes (renal filtration, etc).
Phase 3: transition phase, where the ligand binds to the no-longer saturated receptor.
Phase 4: terminal elimination phase, where elimination of the free ligand happens mainly due to internalization (or degradation) of the target/receptor, which shifts the binding equilibrium out of balance leading to new binding of ligand.
Note that we focus on the concentration of the free ligand, such that binding of the ligand to the receptor constitutes an “elimination” mechanism in that it reduces the concentration of free ligand.
On the opposite, as can be seen on the red curve, if the initial ligand concentration is of the same order of magnitude or lower than the receptor concentration (here R0=100), the free ligand concentration time-curve displays two phases:
Phase 1: steep initial decrease, corresponding to the rapid binding of the ligand to the receptor
Phase 4: terminal elimination phase, where elimination of the free ligand happens mainly due to internalization (or degradation) of the target/receptor, which shifts the binding equilibrium out of balance leading to new binding of ligand
Note that in this case, the receptor is never saturated with ligand and target-mediated elimination usually dominates over the linear elimination. Thus, the curve goes directly from phase 1 to phase 4.
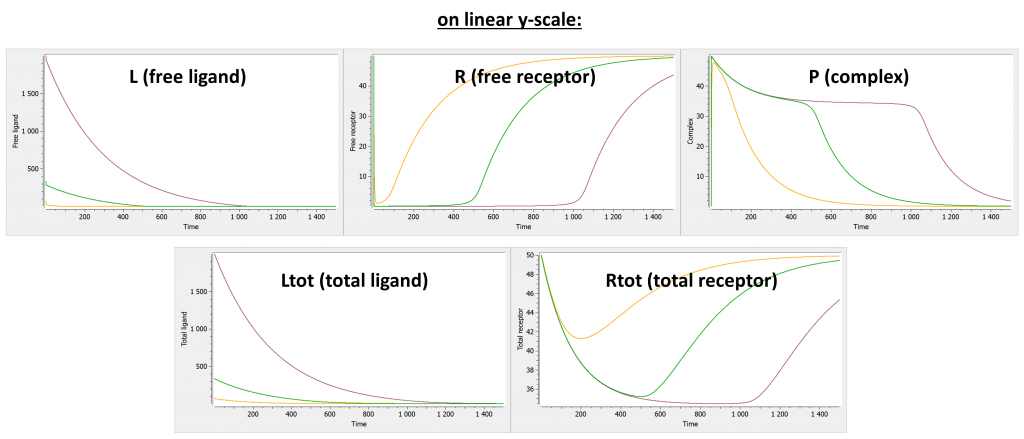
Below we show the typical concentration-time curves for the other entities in linear scale and log scale. The total ligand Ltot is the sum of free ligand L and bound ligand P (complex). The total receptor Rtot is the sum of free receptor R and bound receptor P (complex).
The original TMDD model and its approximations are useful to capture concentration data that display this kind of shapes, or part of them.


