Creating forest plots
The process of creating forest plots based on a Monolix project is explained in this video:
https://www.youtube.com/watch?v=BgGhaAFTpcs
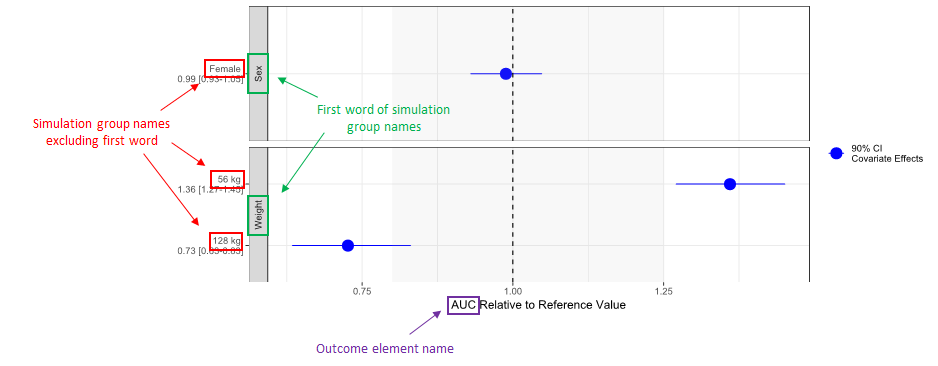
Below you can find an example R function that creates forest plots for visualization of covariate effects on a typical individual based on a Simulx project, as described in the video above. The function plotCovariateEffects takes two arguments:
project – path to the Simulx project,
outcome – name of the outcome that calculates the exposure parameter.
Certain elements of created forest plots will be based on the names of simulation groups and outcomes in the used Simulx project. Here is an image describing the origin of those elements:

library(ggplot2)
library(dplyr)
library(lixoftConnectors)

plotCovariateEffects <- function(project, outcome) {

  # Load a project
  initializeLixoftConnectors("simulx", force = TRUE)
  loadProject(project)

  # Get and format results
  results <- getEndpointsResults()$outcomes
  summary <- results[[outcome]] %>% group_by(group) %>%
    summarise(
      mid = quantile(.data[[outcome]], 0.5),
      lower = quantile(.data[[outcome]], 0.05),
      upper = quantile(.data[[outcome]], 0.95)
    )

  reference_value <- summary[summary$group == "Reference", ]$mid
  summary <- summary %>%
    mutate(across(mid:upper, .fns = ~.x/reference_value)) %>%
    mutate(
      LABEL = paste0(
        format(round(mid, 2), nsmall = 2),
        " [",
        format(round(lower, 2), nsmall = 2),
        "-",
        format(round(upper, 2), nsmall = 2),
        "]"
      )
    )

  summary$covname <- gsub("_.*", "", summary$group)
  summary$label <- gsub("^(.*?)_", "", summary$group)
  summary$label <- gsub("_", " ", summary$label) %>% paste("\n", summary$LABEL)

  # Plot the results
  print(
    ggplot(data = summary[summary$covname != "Reference",], aes_string(
      y = "label",
      x = "mid",
      xmin = "lower",
      xmax = "upper"
    )) +
      geom_pointrange(
        aes(color = "90% CI\nCovariate Effects"),
        size = 1,
        alpha = 1
      ) +
      annotate("rect", xmin = min(0.8), xmax = max(1.25),
               ymin = -Inf, ymax = Inf, fill = "gray", alpha=0.1) +
      geom_vline(aes(xintercept = 1, linetype = "Reference"), linetype = "dashed") +
      facet_grid(covname ~ ., scales = "free_y", switch = "y") +
      labs(y = "", x = paste(outcome, "Relative to Reference Value"),
           colour = "", linetype = "") +
      theme_bw() +
      scale_color_manual(values = c("blue"))
  )
}
It is possible to automate the process of creating the Simulx project using lixoftConnectors. Here you can download two examples that start from a Monolix project and create a Simulx project and forest plots completely in R using lixoftConnectors: download. Example 1 creates forest plots that visualize effect of covariates on a typical individual, while example 2 creates forest plots that illustrate individual exposure.
The explanation of the process is described in this video:
https://www.youtube.com/watch?v=hFQB3fAlcmA
