
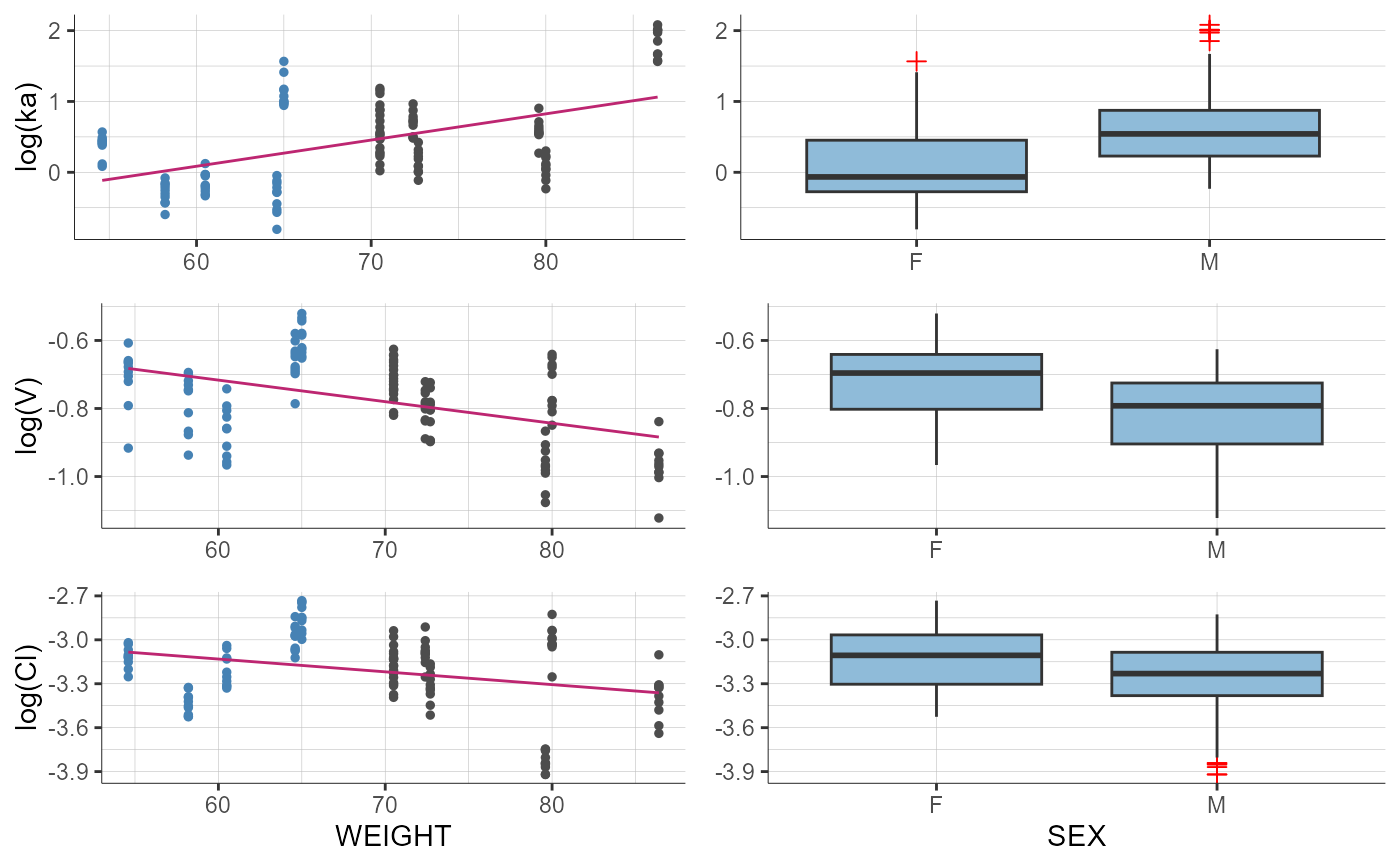
[Monolix] Individual monolix parameter vs covariate plot.
Plot individual parameters vs covariates.
Usage
plotParametersVsCovariates(
  parameters = NULL,
  covariates = NULL,
  settings = list(),
  preferences = list(),
  stratify = list()
)
Arguments
parameters vector of parameters to display. (by default the first 4 computed parameters are displayed). covariates vector of covariates to display. (by default the first 4 computed covariates are displayed). settings List with the following settingsindivEstimate Calculation of individual estimates: conditional mean ("mean"), conditional mode with EBE's ("mode"), conditional distribution ("simulated") (default "simulated"). parameterType (character) display random effect vs covariates ("randomEffect"), or transformed individual parameters vs covariates ("indivParameter") (default "indivParameter"). boxplotData (character) for categorical covariate, if boxplotData is not NULL, data are added as dots over the boxplot. They can be either "spread" on the box or "aligned" (default NULL) regressionLine (logical) If TRUE, Add regression line in scatterplots (default TRUE). spline (logical) If TRUE, Add xpline in scatterplots (default FALSE). legend (logical) add (TRUE) / remove (FALSE) plot legend (default FALSE). grid (logical) add (TRUE) / remove (FALSE) plot grid (default TRUE). ncol (integer) number of columns when facet = TRUE (default 4). fontsize (integer) Plot text font size. preferences (optional) preferences for plot display, run getPlotPreferences("plotParametersVsCovariates") to check available displays. stratify List with the stratification arguments:groups - Definition of stratification groups. By default, stratification groups are already defined as one group for each category for categorical covariates, and two groups of equal number of individuals for continuous covariates. To redefine groups, for each covariate to redefine, specify a list with:namecharactercovariate name (e.g "AGE")definition(vector(continuous) || list>(categorical))For continuous covariates, vector of break values (e.g c(35, 65)). For categorical covariates, groups of categories as a list of vectors(e.g list(c("study101"), c("study201","study202"))) split (vector) - Vector of covariates used to split (i.e facet) the plot (by default no split is applied). For instance c("FORM","AGE"). filter (list< list> >) - List of pairs containing a covariate name and the vector of indexes or categories (for categorical covariates) of the groups to keep (by default no filtering is applied). For instance, list("AGE",c(1,3)) to keep the individuals belonging to the first and third age group, according to the definition in groups. For instance, list("FORM","ref") using the category name for categorical covariates. color (vector) - Vector of covariates used for coloring (by default no coloring is applied). For instance c("FORM","AGE"). colors - Vector of colors to use when color argument is used. Takes precedence over colors defined in preferences. For instance c("#ebecf0","#cdced1","#97989c").
Value
-
A ggplot object if one covariate and one parameter in argument,
-
A TableGrob object if multiple plots (output of grid.arrange)
See also
getChartsData getPlotPreferences
Examples
  initializeLixoftConnectors(software="monolix")
  project <- file.path(getDemoPath(), "1.creating_and_using_models",
                       "1.1.libraries_of_models", "theophylline_project.mlxtran")
  loadProject(project)

  runPopulationParameterEstimation()
  runConditionalDistributionSampling()

  # Individual parameters
  plotParametersVsCovariates(covariates = "SEX", parameters = "Cl")

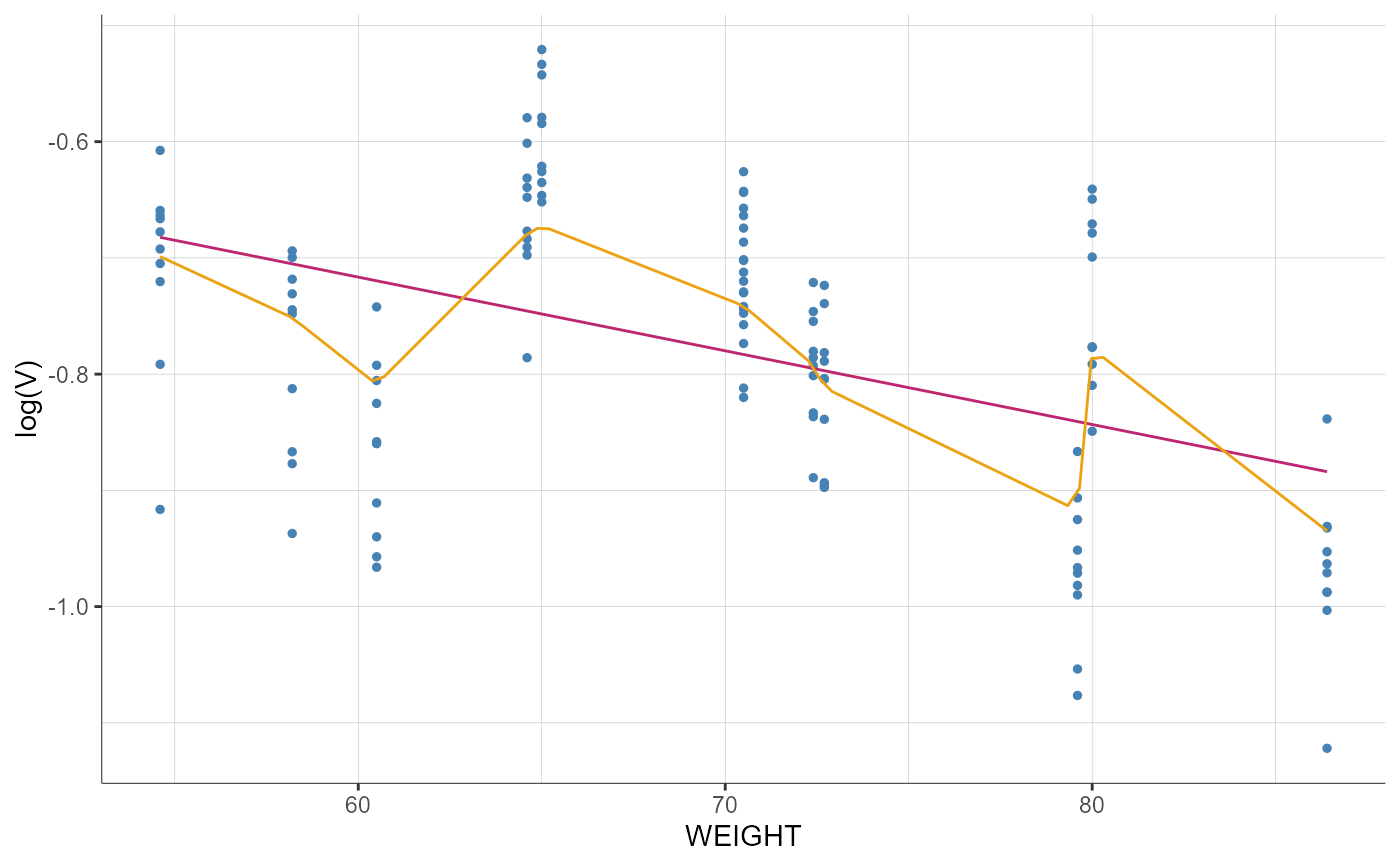
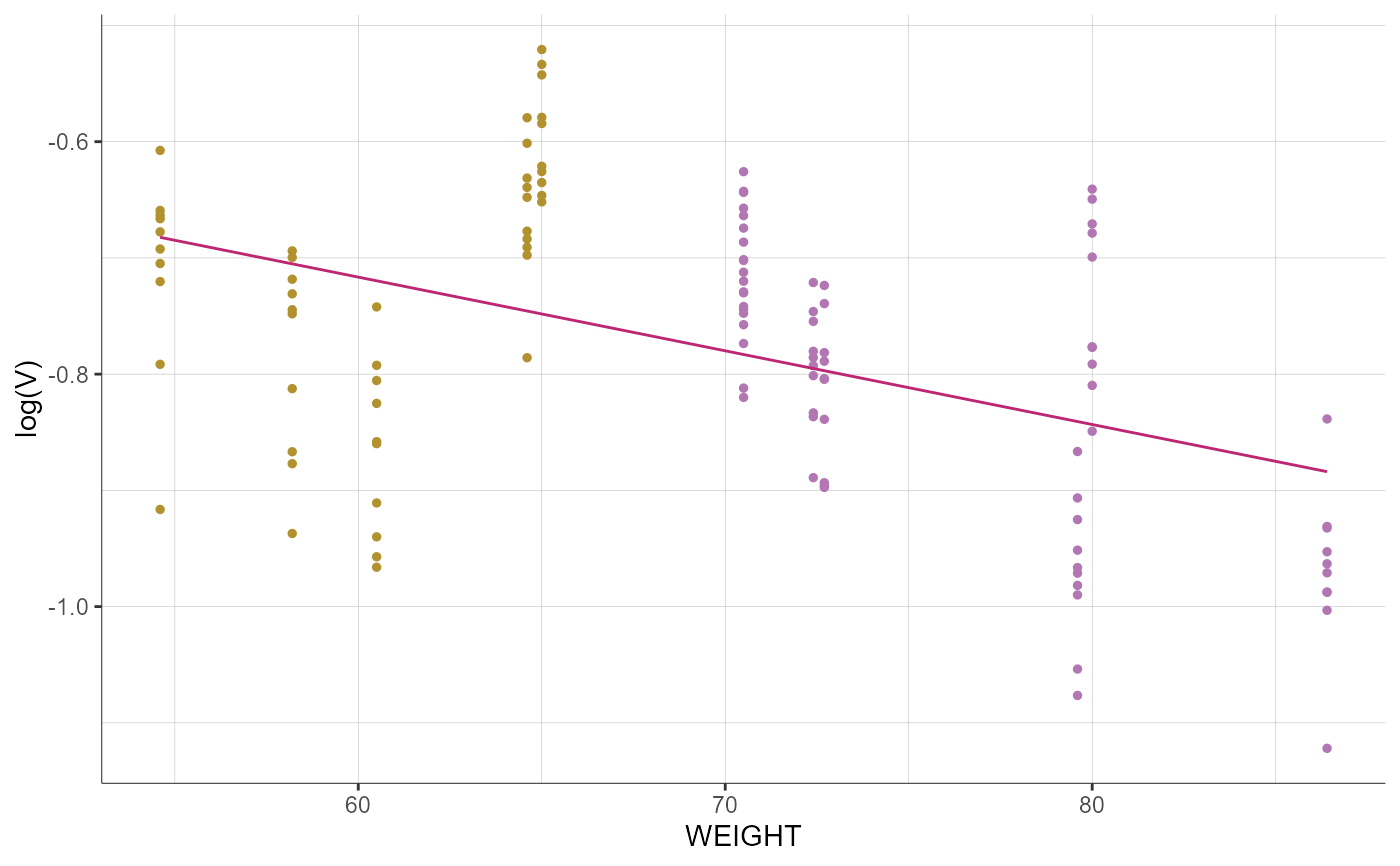
plotParametersVsCovariates(covariates = "WEIGHT", parameters = "V", settings = list(spline = T))
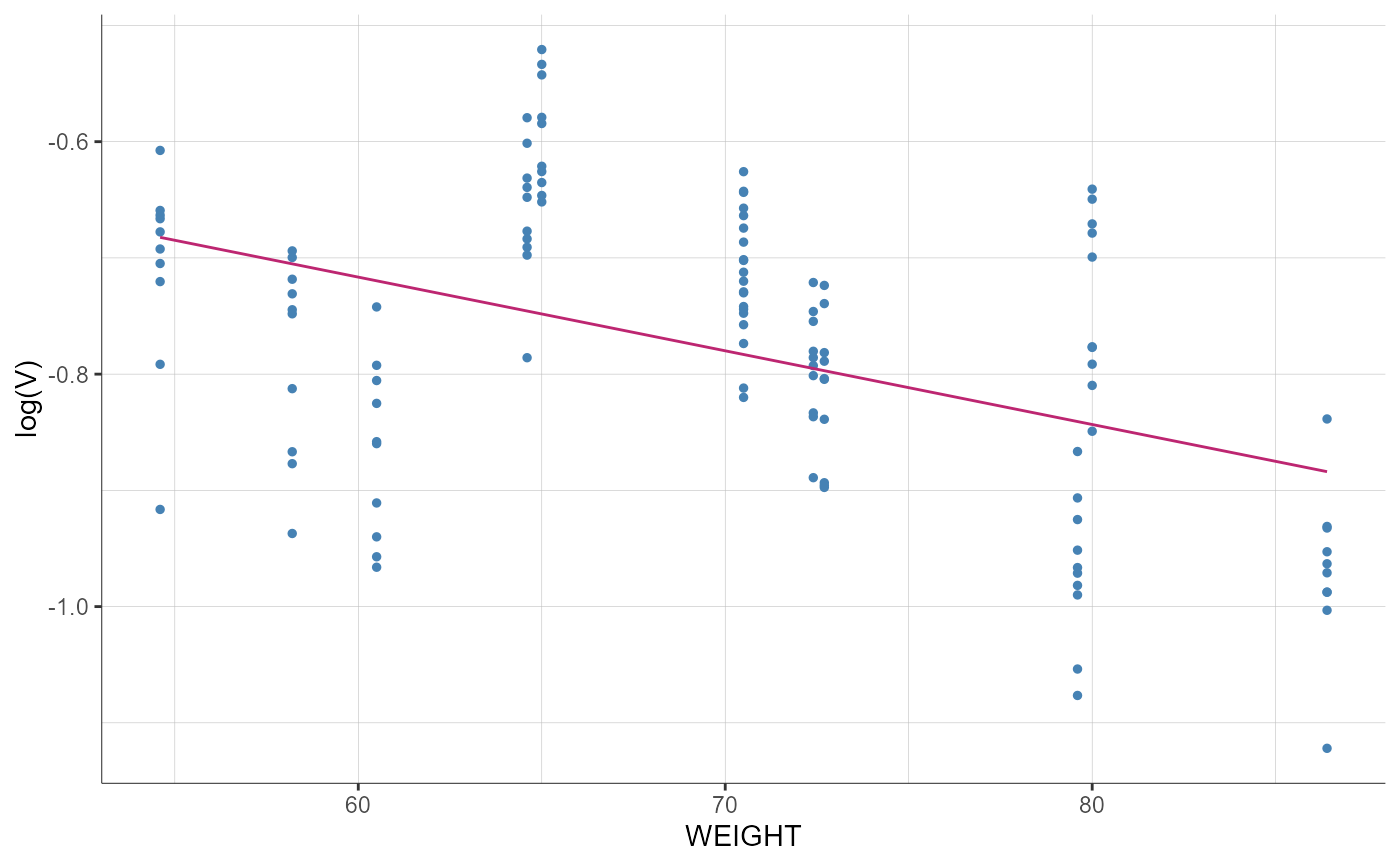
  plotParametersVsCovariates(covariates = "WEIGHT", parameters = "V",
                             settings = list(indivEstimate = "simulated"))
# Random effects
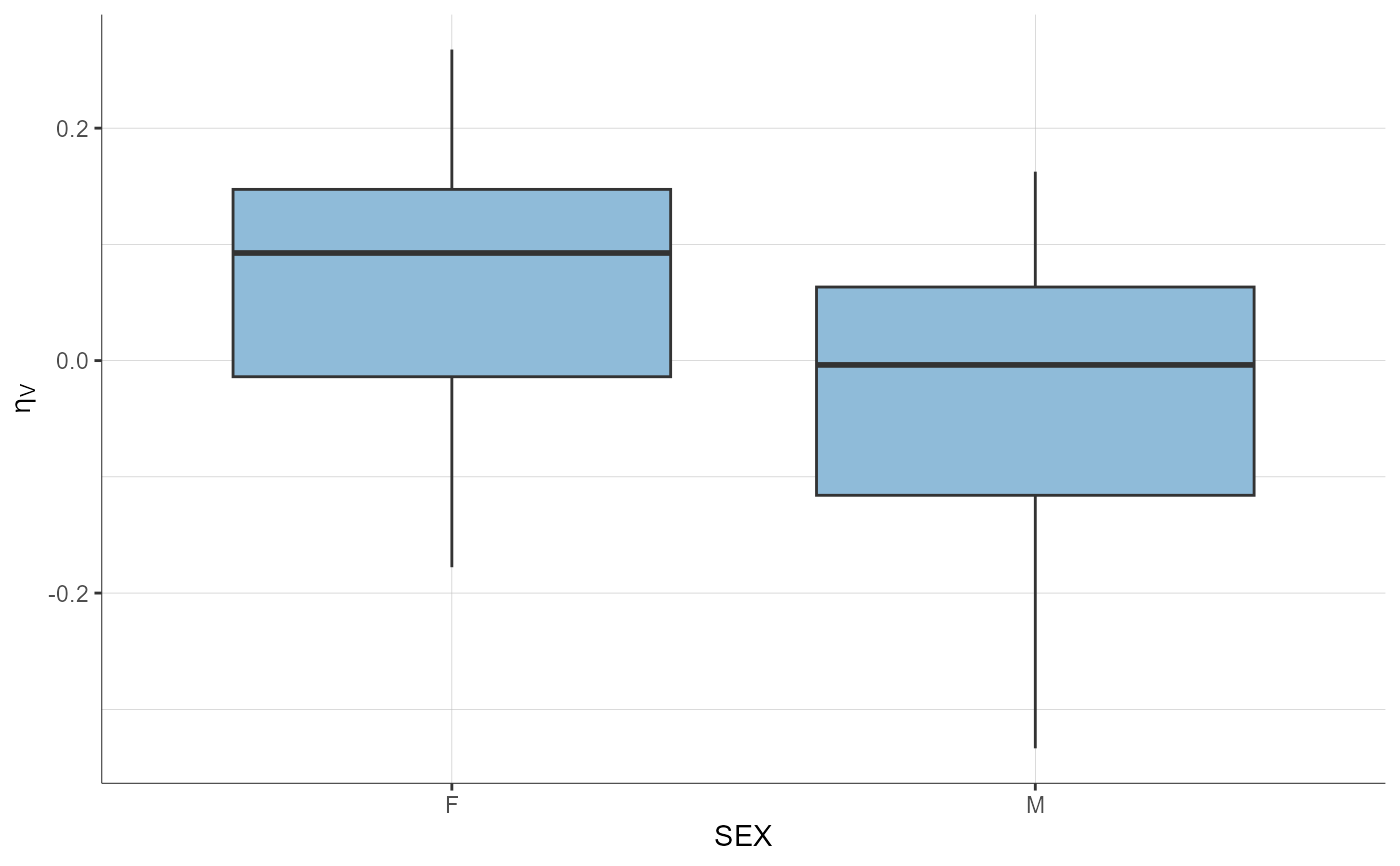
plotParametersVsCovariates(covariates = "SEX", parameters = "V",
settings = list(parameterType = "randomEffect"))
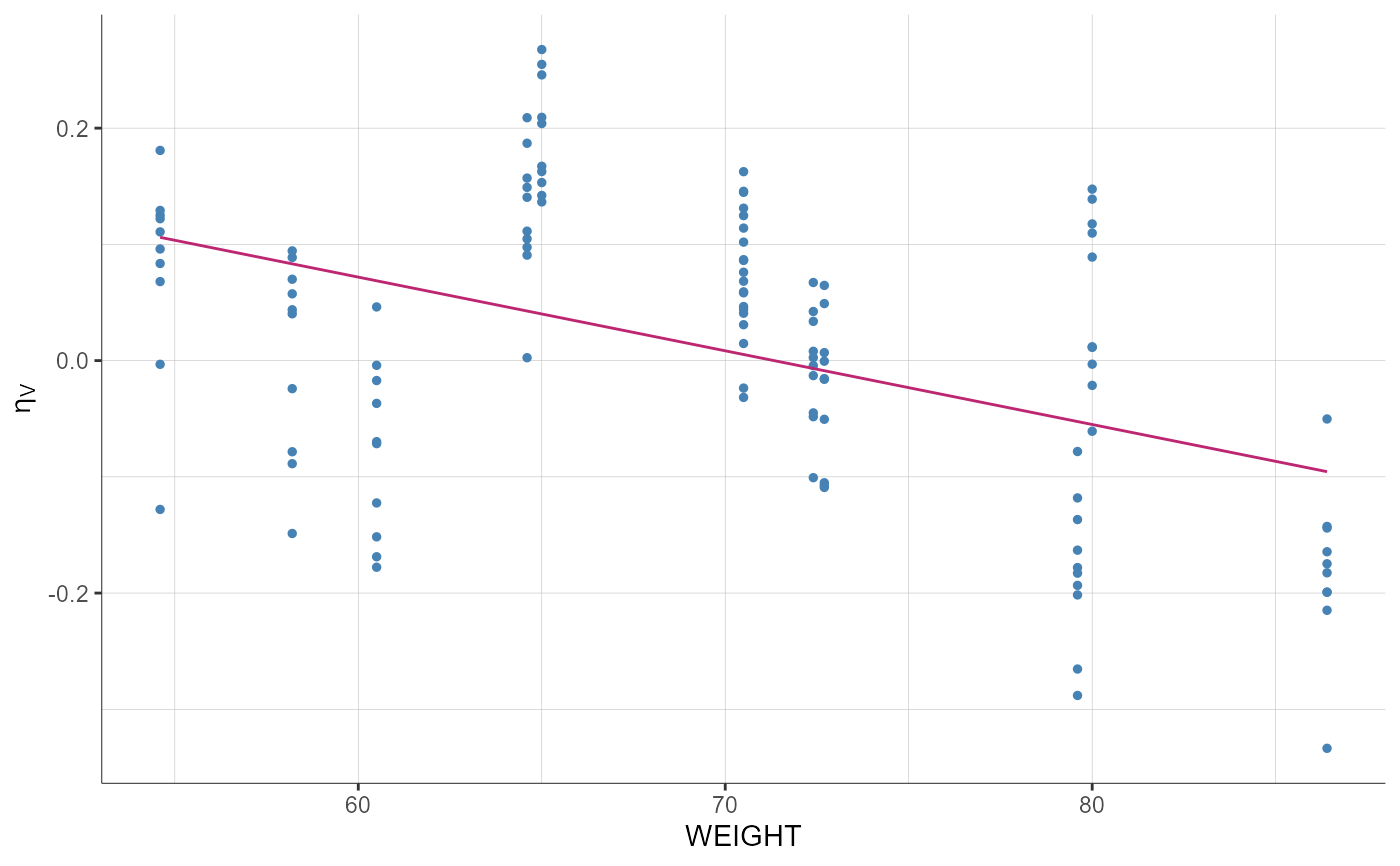
  plotParametersVsCovariates(covariates = "WEIGHT", parameters = "V",
                             settings = list(indivEstimate = "simulated", parameterType = "randomEffect"))
# Stratification
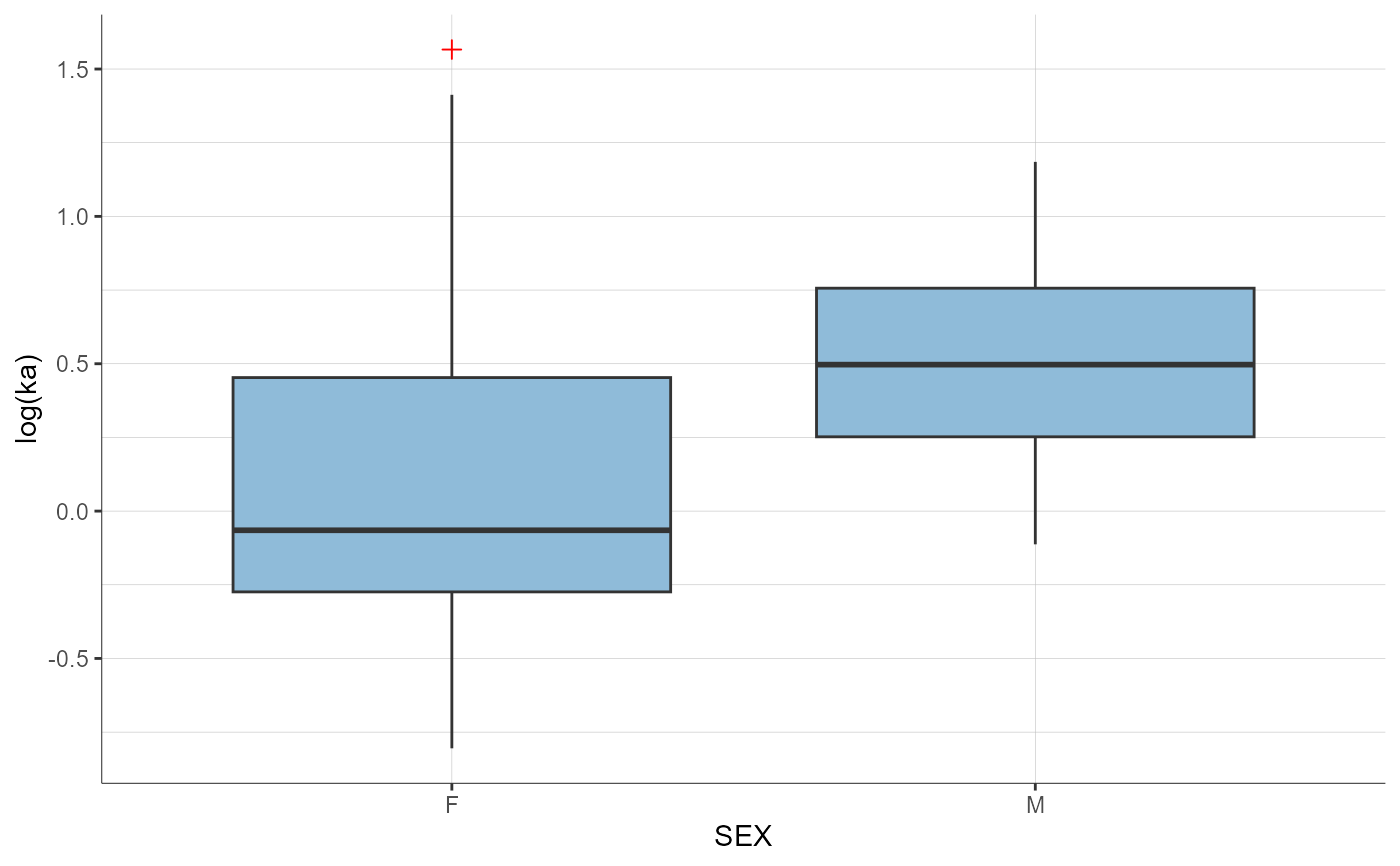
plotParametersVsCovariates(covariates = "SEX", parameters = "ka",
stratify = list(filter = list("WEIGHT", 1),
groups = list(name = "WEIGHT", definition = 75)))
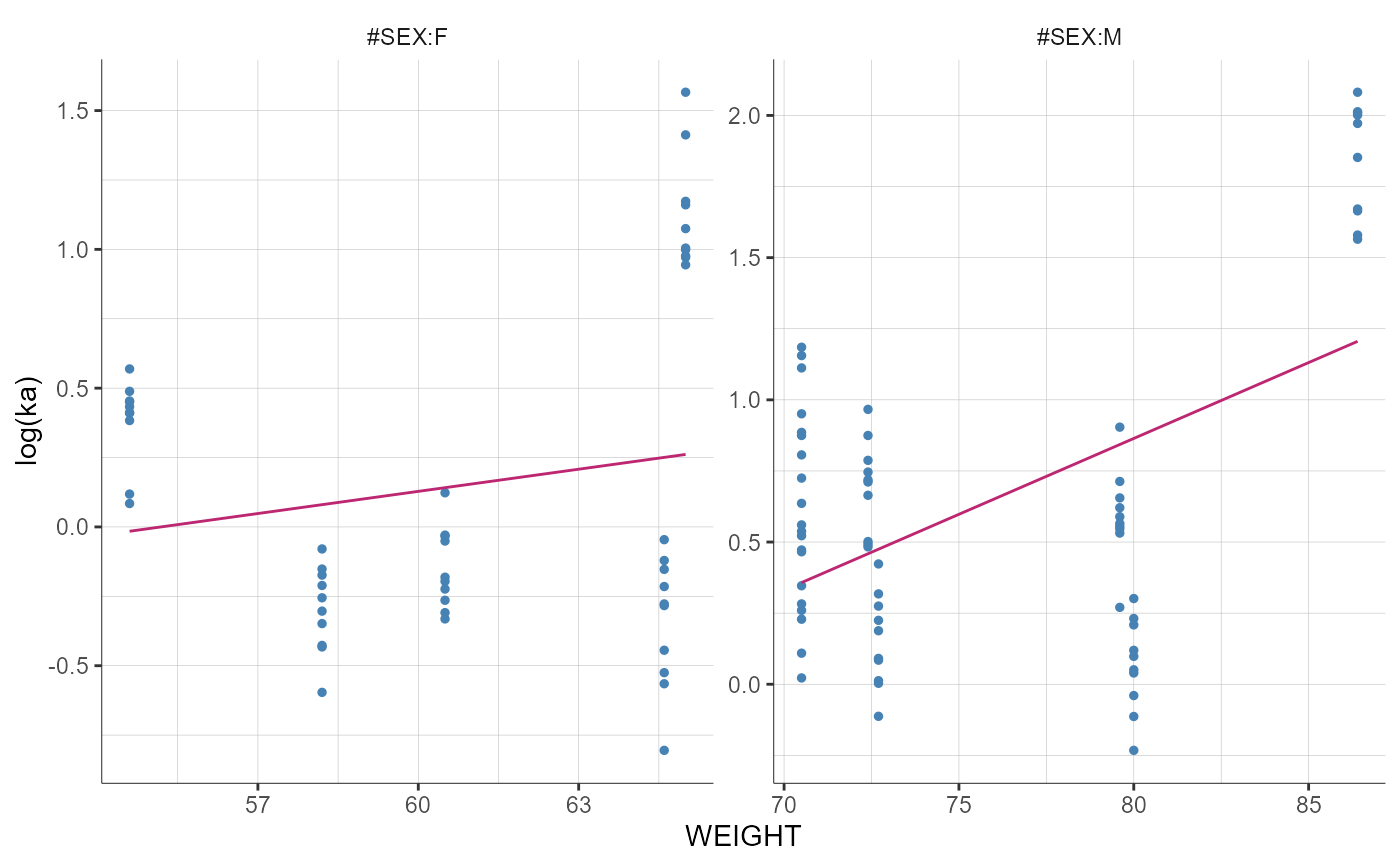
  plotParametersVsCovariates(covariates = "WEIGHT", parameters = "ka",
                             stratify = list(split = "SEX"))
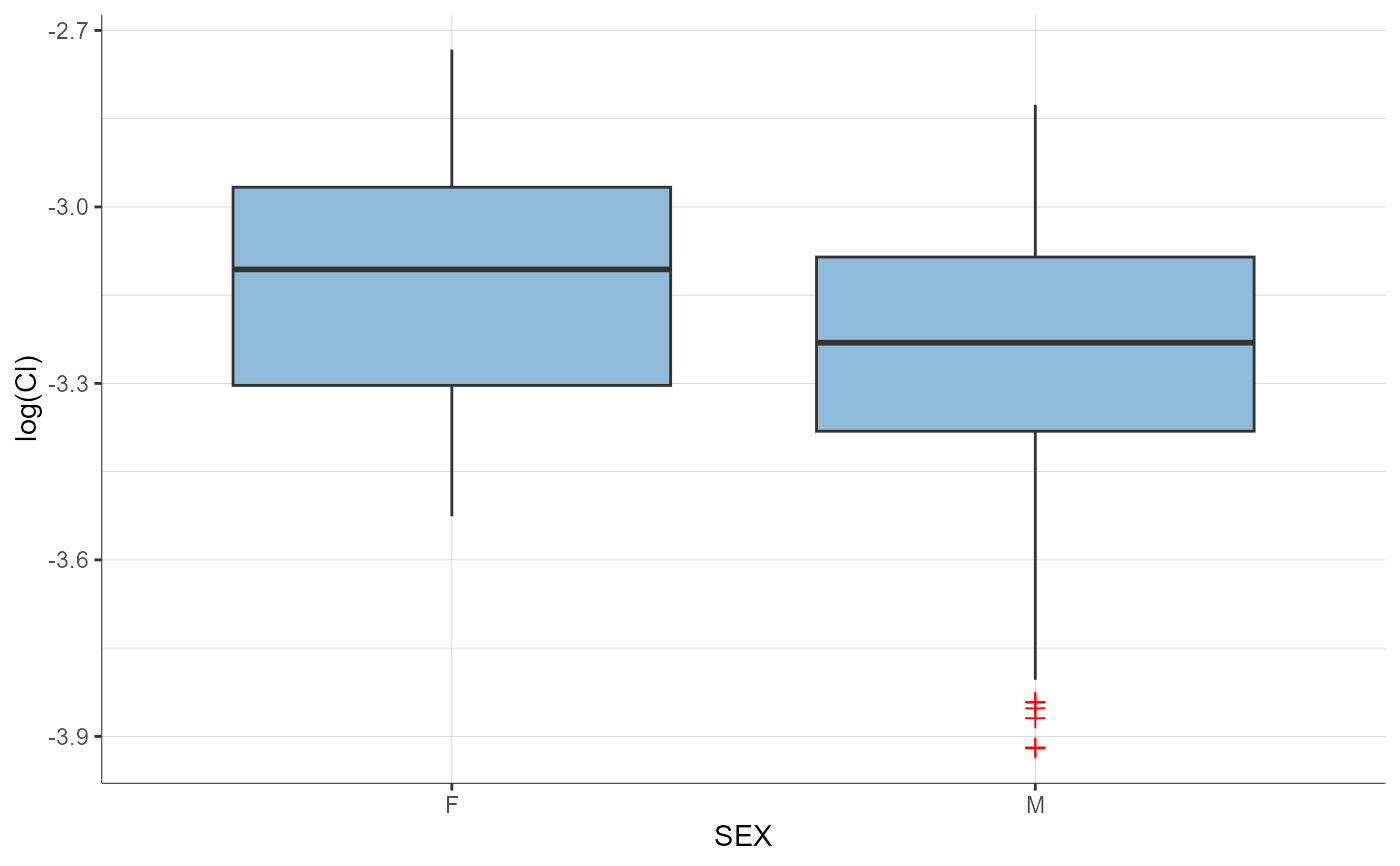
  plotParametersVsCovariates(covariates = "SEX", parameters = "Cl",
                             stratify = list(color = "WEIGHT",
                                             groups = list(name = "WEIGHT", definition = 75)))
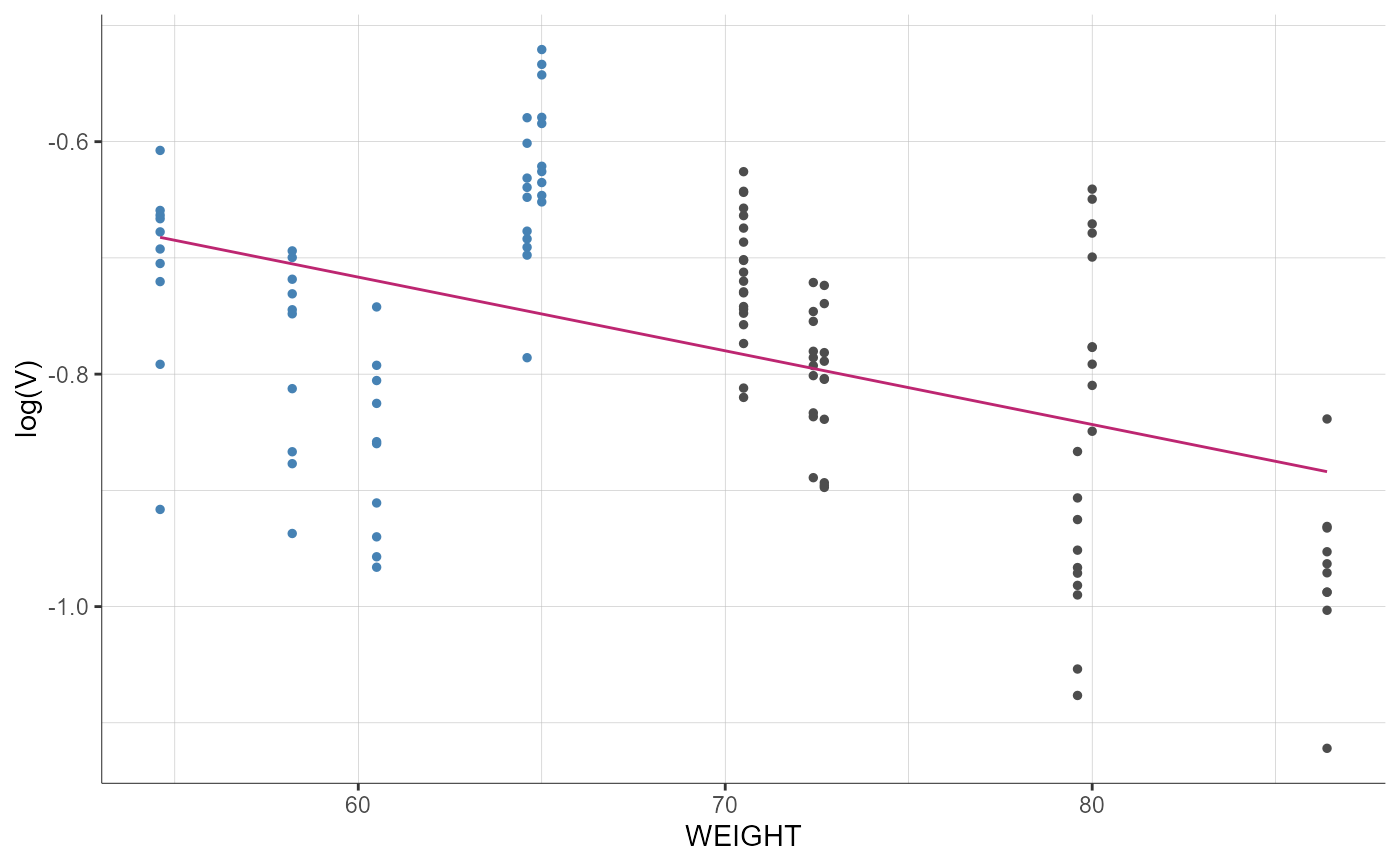
  plotParametersVsCovariates(covariates = "WEIGHT", parameters = "V",
                             stratify = list(color = "SEX"))
  plotParametersVsCovariates(covariates = "WEIGHT", parameters = "V",
                             stratify = list(color = c("SEX", "WEIGHT"),
                                             groups = list(name = "WEIGHT", definition = 70)))
  # multiple plots
  plotParametersVsCovariates()

#> TableGrob (1 x 1) "arrange": 1 grobs
#>   z     cells    name            grob
#> 1 1 (1-1,1-1) arrange gtable[arrange]
  plotParametersVsCovariates(covariates = "WEIGHT")
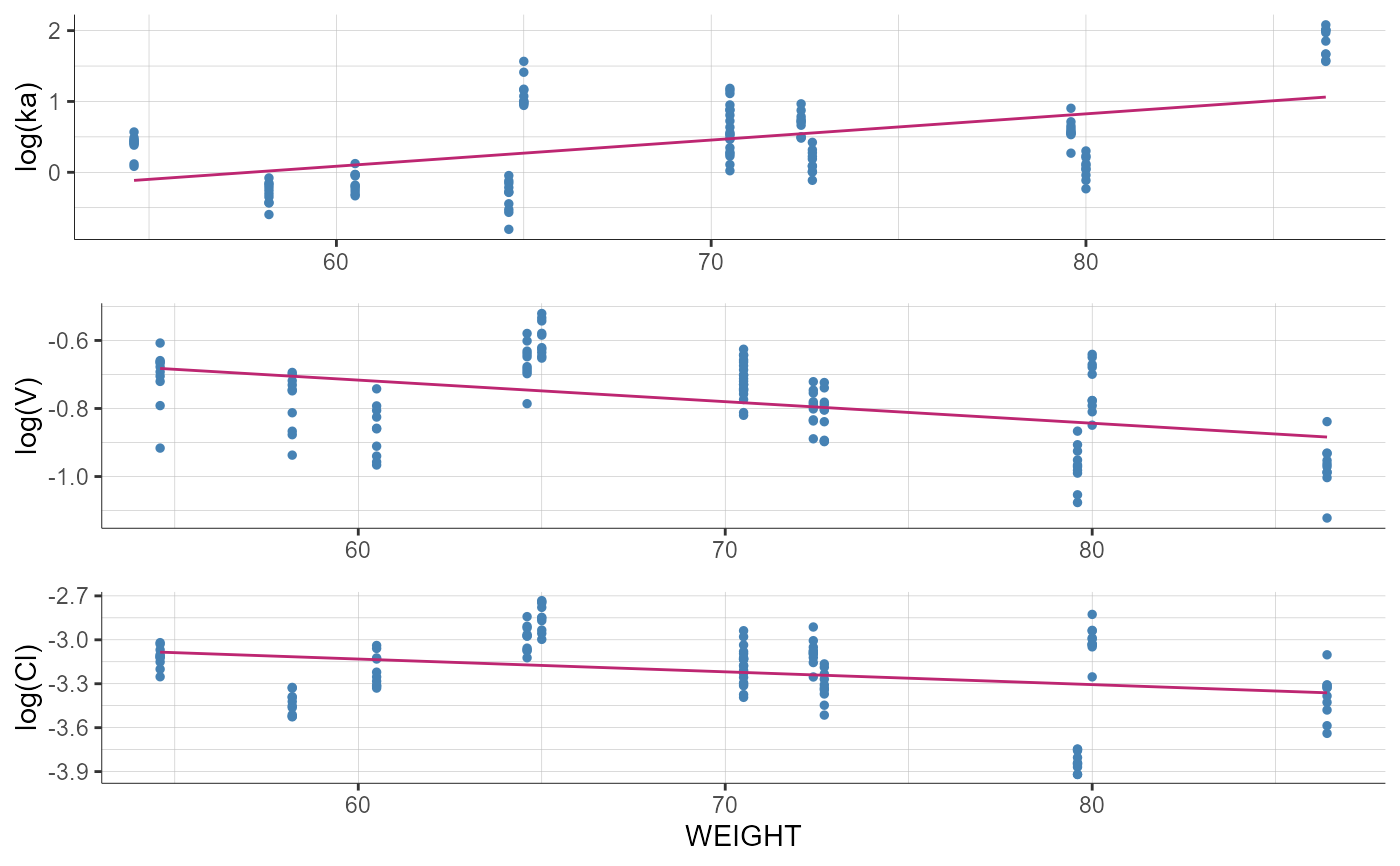
#> TableGrob (1 x 1) "arrange": 1 grobs
#>   z     cells    name            grob
#> 1 1 (1-1,1-1) arrange gtable[arrange]
  plotParametersVsCovariates(settings = list(indivEstimate = "simulated"))

#> TableGrob (1 x 1) "arrange": 1 grobs
#>   z     cells    name            grob
#> 1 1 (1-1,1-1) arrange gtable[arrange]
  plotParametersVsCovariates(settings = list(parameterType = "randomEffect"))
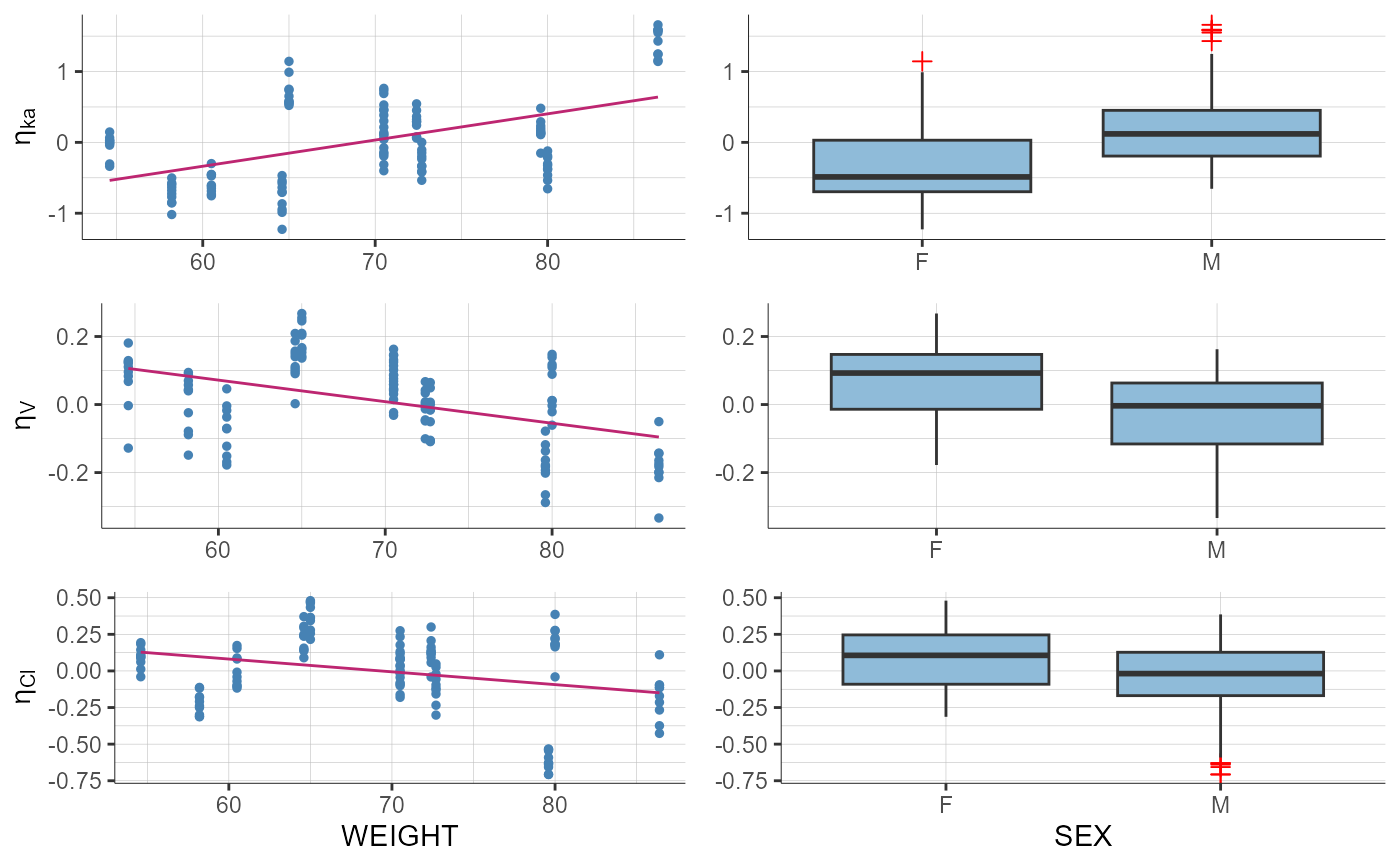
#> TableGrob (1 x 1) "arrange": 1 grobs
#>   z     cells    name            grob
#> 1 1 (1-1,1-1) arrange gtable[arrange]
  plotParametersVsCovariates(settings = list(parameterType = "randomEffect", indivEstimate = "simulated"))

#> TableGrob (1 x 1) "arrange": 1 grobs
#>   z     cells    name            grob
#> 1 1 (1-1,1-1) arrange gtable[arrange]
  plotParametersVsCovariates(stratify = list(color = "WEIGHT",
                                             groups = list(name="WEIGHT", definition = 75)))
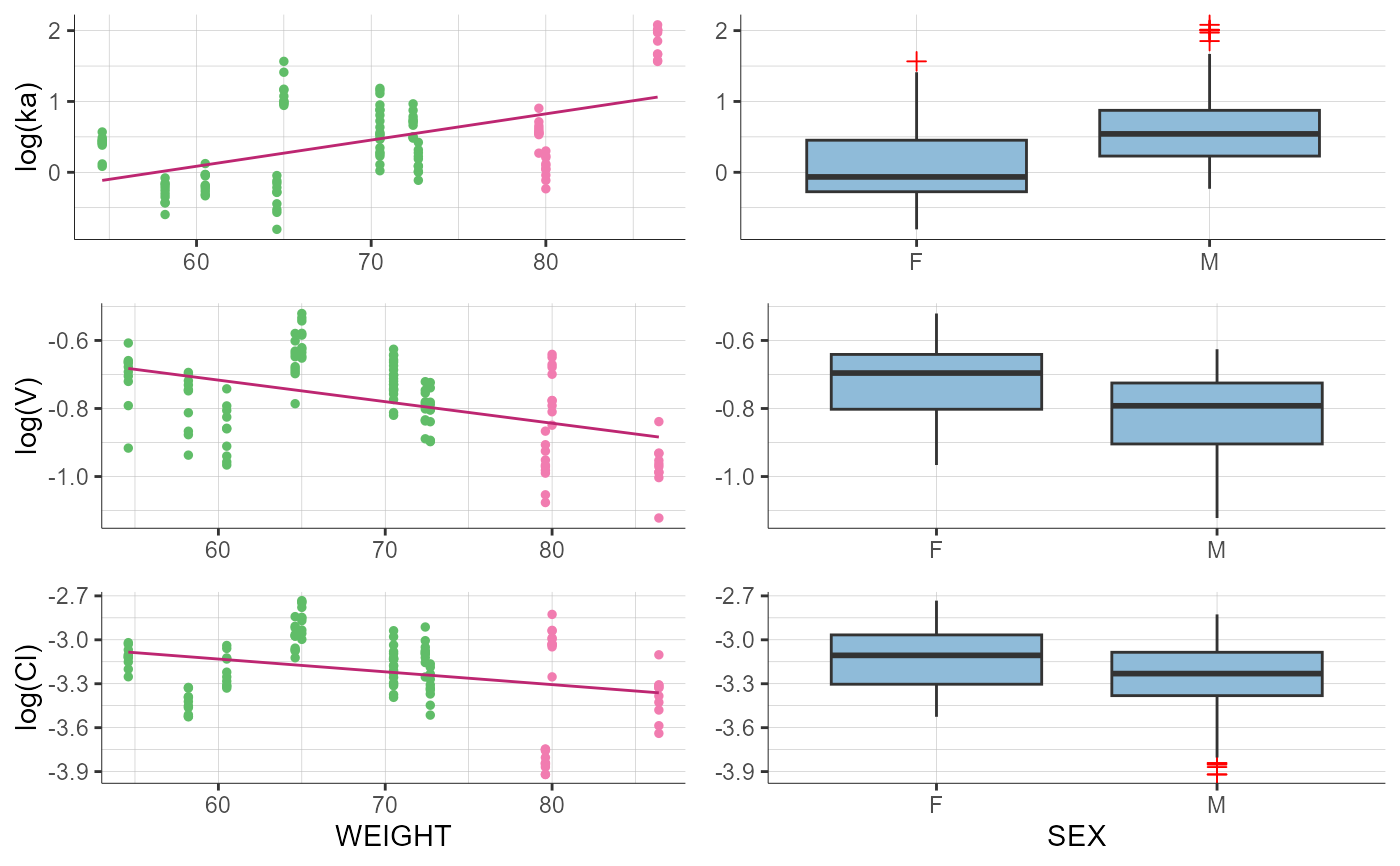
#> TableGrob (1 x 1) "arrange": 1 grobs
#>   z     cells    name            grob
#> 1 1 (1-1,1-1) arrange gtable[arrange]
  plotParametersVsCovariates(stratify = list(color = "SEX"))
#> TableGrob (1 x 1) "arrange": 1 grobs
#>   z     cells    name            grob
#> 1 1 (1-1,1-1) arrange gtable[arrange]