
[PKanalix] Plot the bioequivalence sequence-by-period
Plot the bioequivalence parameters as sequence-by-period. The https://pkanalix.lixoft.com/bioequivalence/sequence-by-period-plot/sequence-by-period plot allows to visualize, for each parameter, the mean and standard deviation for each period, sequence and formulation.
Usage
plotBESequenceByPeriod(
  parameters = NULL,
  settings = list(),
  preferences = NULL,
  stratify = list()
)
Arguments
parameters (vector) vector of NCA parameters (included in BE calculations) to display. (by default the first 4 computed parameters are displayed). settings List with the following settings:dots (logical) - If TRUE, parameters averaged over period and sequence are displayed as dots (default TRUE). lines (logical) - If TRUE, parameters averages belonging to the same sequence are connected by lines (default TRUE). error (logical) - If TRUE, standard deviations are displayed as error bars (default TRUE). formulationColors (vector) Vector of colors to use for each formulation when there is more than one formulation. legend (logical) If TRUE, plot legend is displayed (default FALSE). grid (logical) If TRUE, plot grid is displayed (default TRUE). ylog (logical) If TRUE, log-scale on y axis is used (default FALSE). ncol (integer) Number of columns to arrange subplots (default 4). fontsize (integer) Font size of text elements (default 11). units (logical) If TRUE, units are added in axis labels (default TRUE). xlab (character) Label on x-axis (no label by default) . preferences (optional) preferences for plot display, run getPlotPreferences("plotBESequenceByPeriod") to check available options. stratify List with the stratification arguments:groups - Definition of stratification groups. By default, stratification groups are already defined as one group for each category for categorical covariates, and two groups of equal number of individuals for continuous covariates. To redefine groups, for each covariate to redefine, specify a list with:namecharactercovariate name (e.g "AGE")definitionvector(continuous) || list>(categorical)For continuous covariates, vector of break values (e.g c(35, 65)). For categorical covariates, groups of categories as a list of vectors(e.g list(c("study101"), c("study201","study202"))) split (vector) - Vector of covariates used to split (i.e facet) the plot (by default no split is applied). For instance c("FORM","AGE"). filter (list< list> >) - List of pairs containing a covariate name and the vector of indexes or categories (for categorical covariates) of the groups to keep (by default no filtering is applied). For instance, list("AGE",c(1,3)) to keep the individuals belonging to the first and third age group, according to the definition in groups. For instance, list("FORM","ref") using the category name for categorical covariates.
Value
-
A ggplot object if only one parameter is given in
parameters -
A TableGrob object if multiple plots (output of grid.arrange)
See also
Examples
initializeLixoftConnectors(software = "pkanalix")
project <- file.path(getDemoPath(), "/3.bioequivalence/project_crossover_bioequivalence.pkx")
loadProject(project)
runNCAEstimation()
runBioequivalenceEstimation()
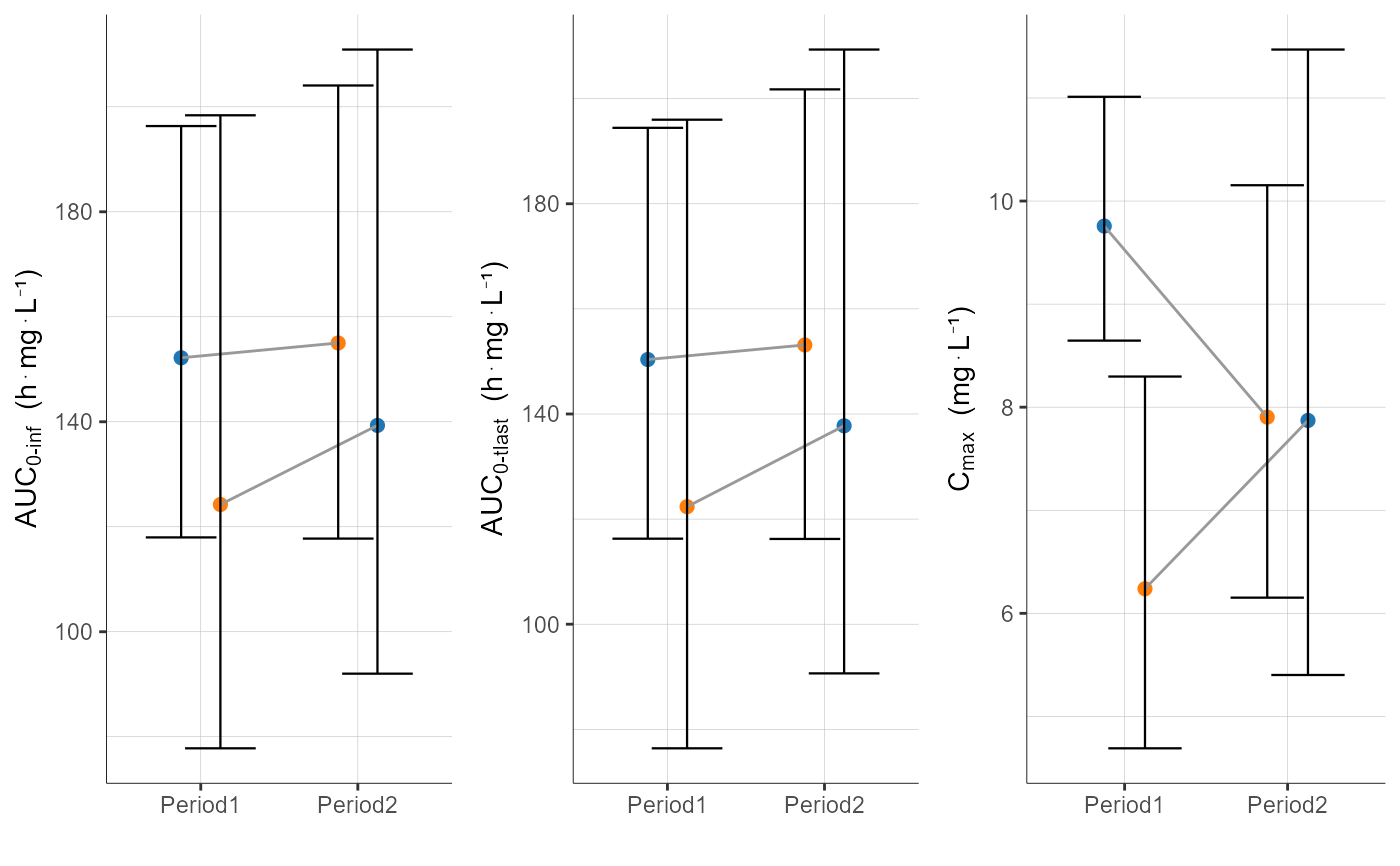
# display by default
plotBESequenceByPeriod()
#> TableGrob (1 x 1) "arrange": 1 grobs
#> z cells name grob
#> 1 1 (1-1,1-1) arrange gtable[arrange]
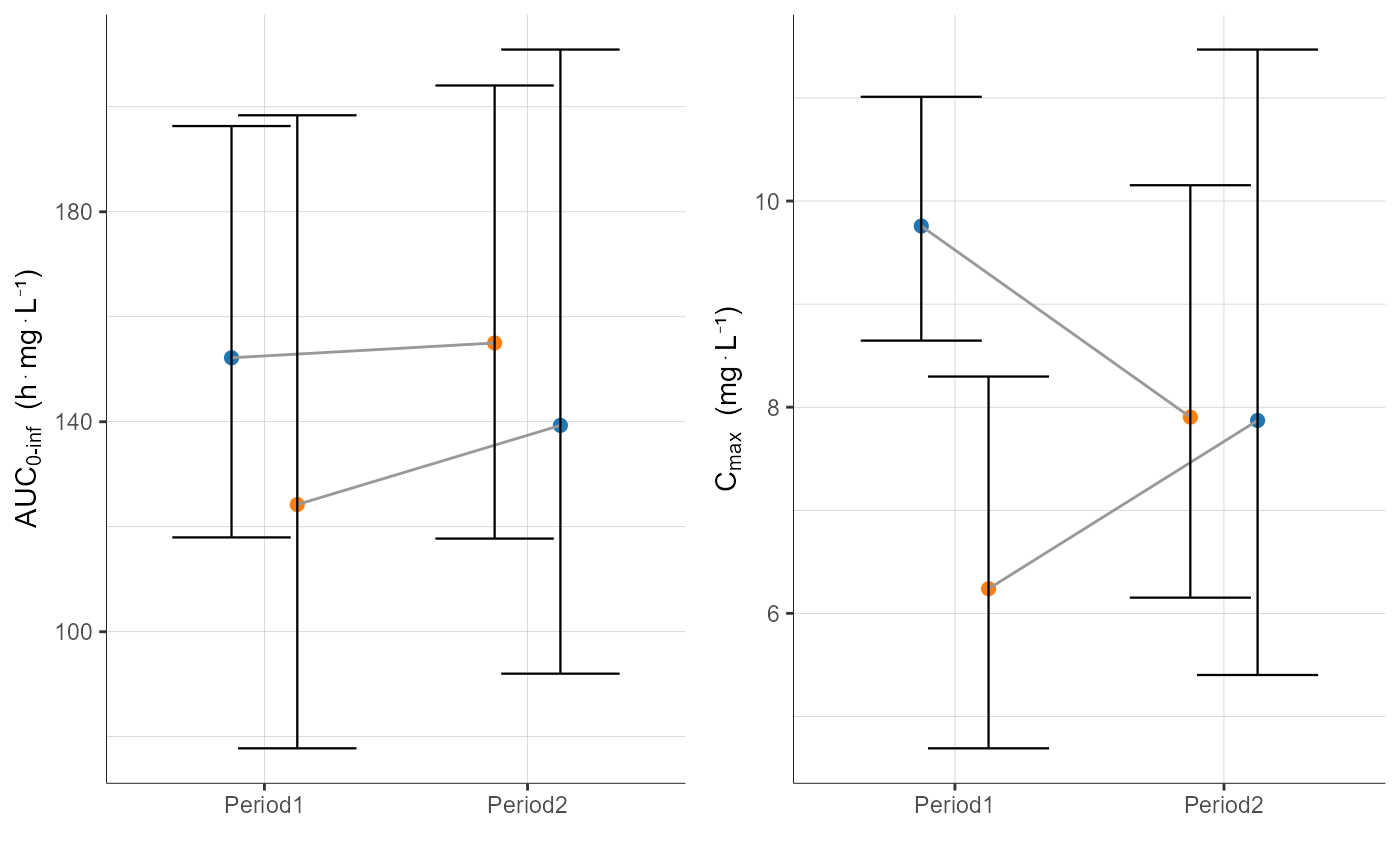
# select only a subplot of parameters used for BE analysis
plotBESequenceByPeriod(parameters = c("AUCINF_obs","Cmax"))
#> TableGrob (1 x 1) "arrange": 1 grobs
#> z cells name grob
#> 1 1 (1-1,1-1) arrange gtable[arrange]
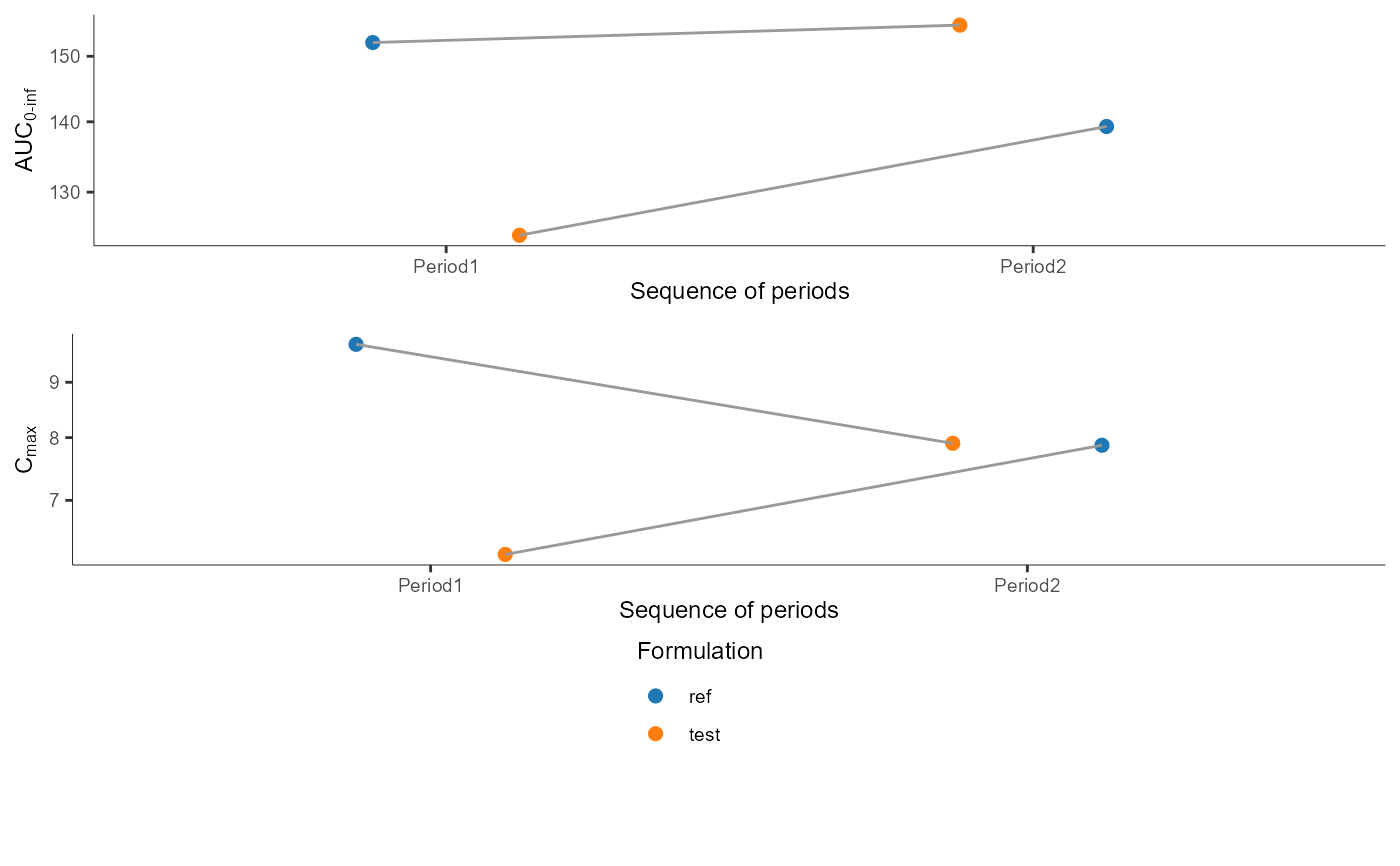
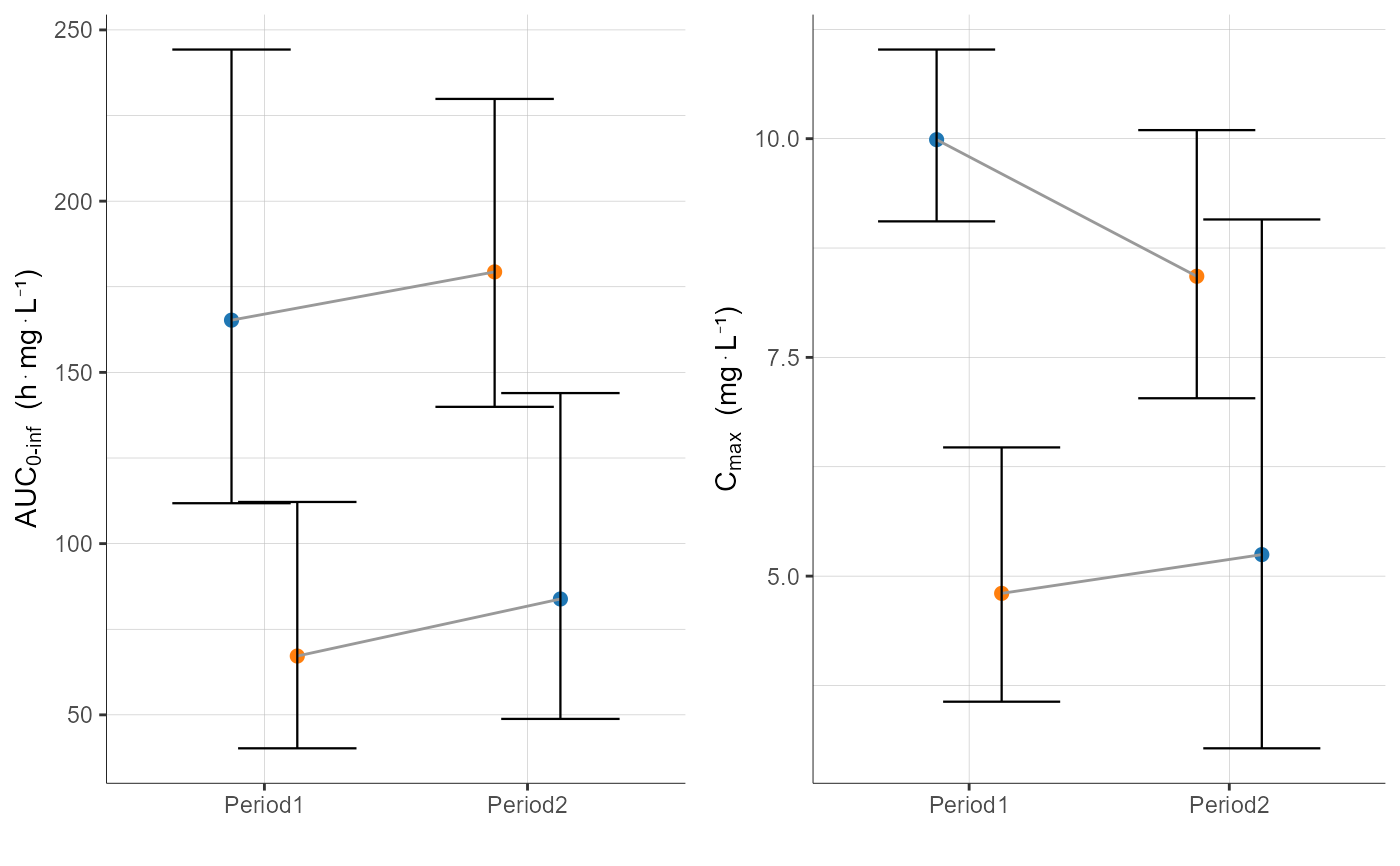
# changing the settings
plotBESequenceByPeriod(parameters = c("AUCINF_obs","Cmax"),
settings=list(dots=T,
lines=T,
error=F,
legend=T,
grid=F,
ylog=T,
ncol=1,
units=F,
fontsize=9,
xlab="Sequence of periods"))
#> TableGrob (2 x 1) "arrange": 2 grobs
#> z cells name grob
#> 1 1 (1-1,1-1) arrange gtable[arrange]
#> 2 2 (2-2,1-1) arrange gtable[guide-box]
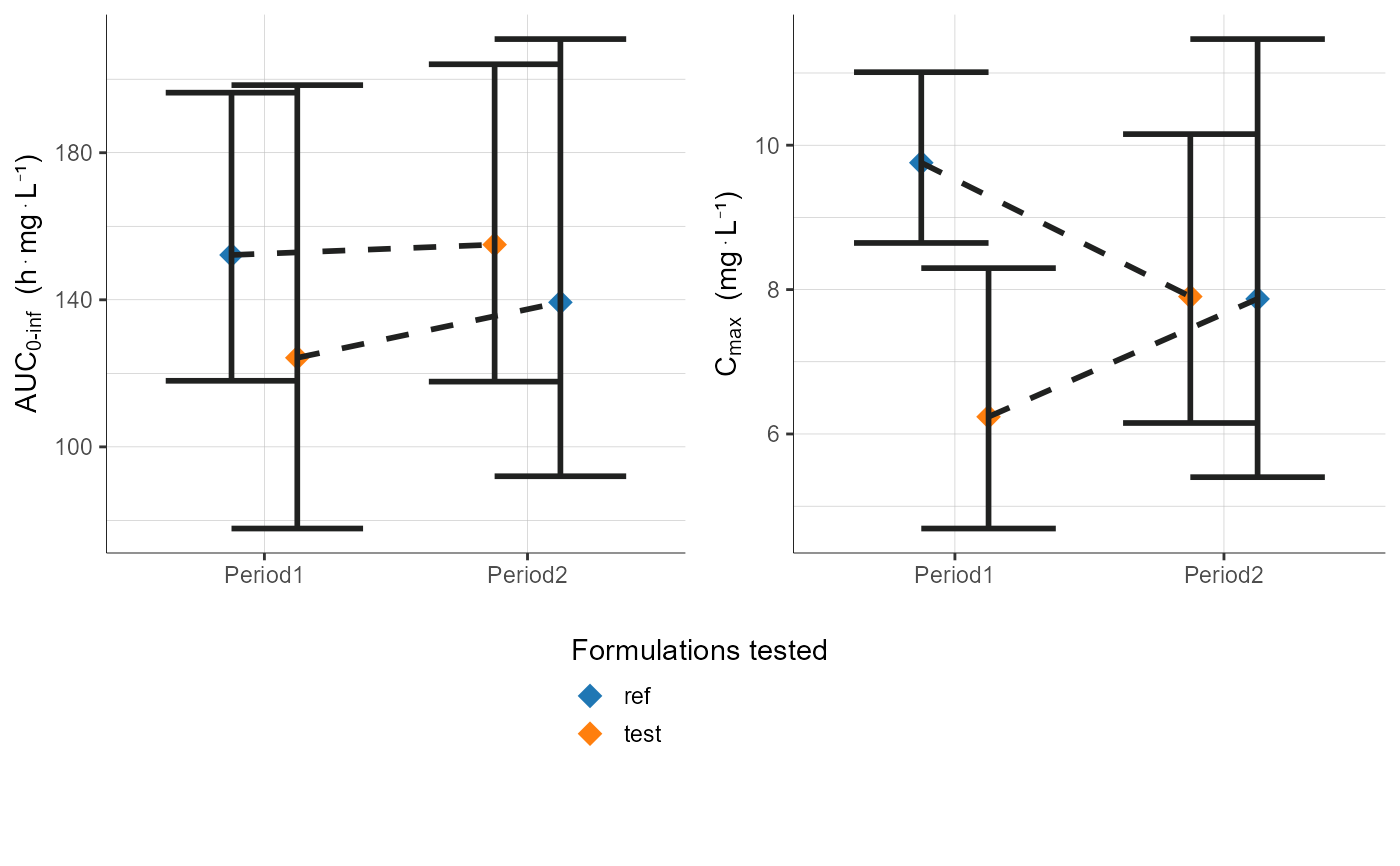
# changing the preferences
plotBESequenceByPeriod(parameters = c("AUCINF_obs","Cmax"),
settings=list(legend=T),
preferences = list(formulationDot=list(radius=4,
shape=18,
legend="Formulations tested"),
observationStatistics=list(color="#202120",
whiskersWidth=1,
lineWidth=1,
lineType="solid",
legend="Standard deviation"),
sequence=list(color="#202120",
lineWidth=1,
lineType="dashed",
legend="Sequences")))
#> TableGrob (2 x 1) "arrange": 2 grobs
#> z cells name grob
#> 1 1 (1-1,1-1) arrange gtable[arrange]
#> 2 2 (2-2,1-1) arrange gtable[guide-box]
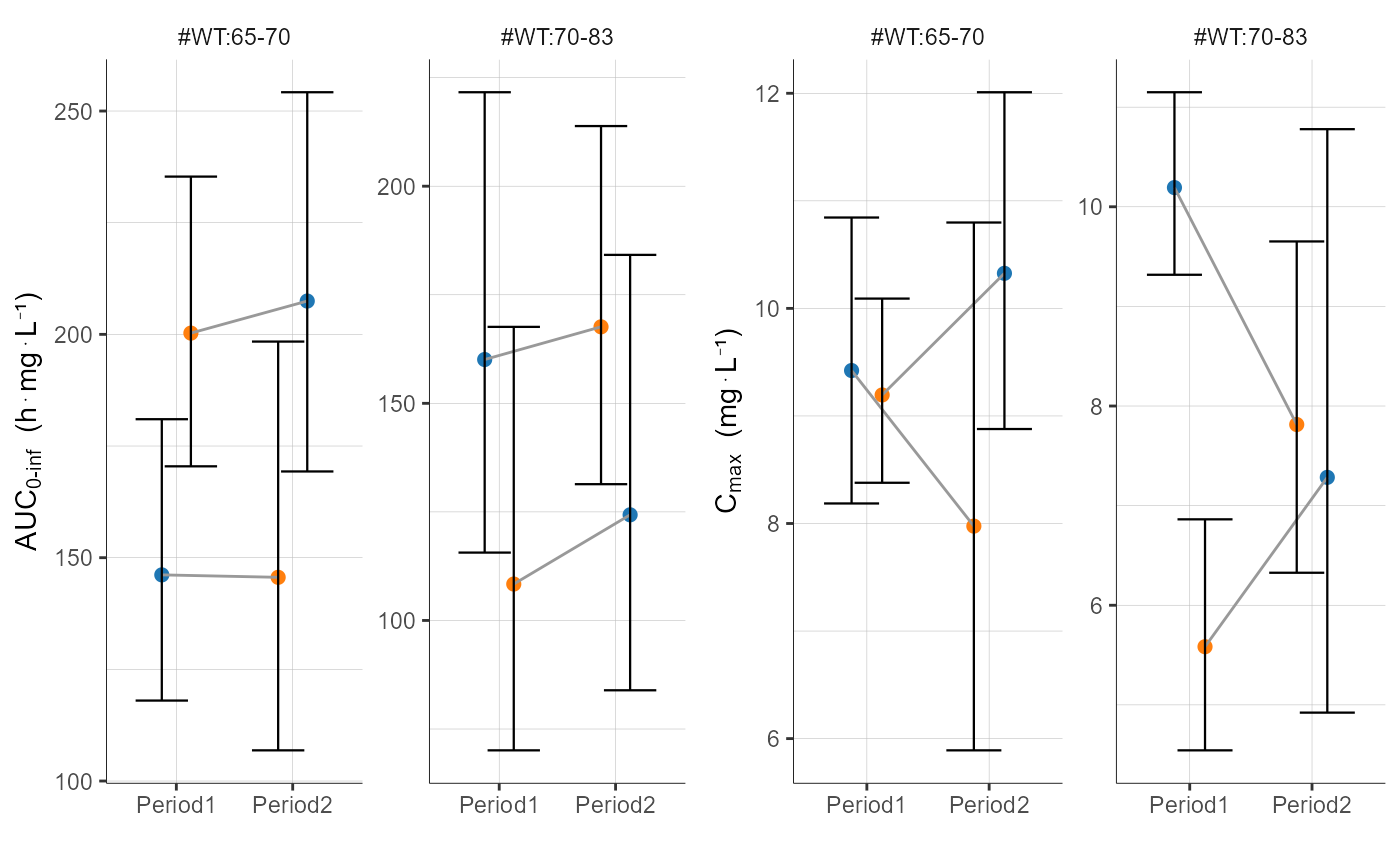
# define groups of WT and split by WT
plotBESequenceByPeriod(parameters = c("AUCINF_obs","Cmax"),
stratify=list(groups=list(name="WT", definition=c(70)),
split=c("WT")))
#> TableGrob (1 x 1) "arrange": 1 grobs
#>   z     cells    name            grob
#> 1 1 (1-1,1-1) arrange gtable[arrange]

# define groups of AGE and WT and filter by AGE and WT
plotBESequenceByPeriod(parameters = c("AUCINF_obs","Cmax"),
                       stratify=list(groups=list(list(name="WT", definition=c(70)),
                                                 list(name="AGE", definition=c(24,34))),
                                     filter=list(list("AGE",c(1,3)),
                                                 list("WT",2))))
#> TableGrob (1 x 1) "arrange": 1 grobs
#>   z     cells    name            grob
#> 1 1 (1-1,1-1) arrange gtable[arrange]