[PKanalix] BE Confidence Intervals plot
Plot the individual NCA parameters vs covariates.
Usage
plotBEConfidenceIntervals(
  parameters = NULL,
  formulations = NULL,
  settings = list(),
  preferences = NULL
)
Arguments
parameters vector of bioequivalence parameters to display. (by default the first 4 computed parameters are displayed). formulations vector of test formulations to display. (by default the first 4 test formulations are displayed). settings List with the following settingsmedian (logical) - If TRUE median is displayed (default TRUE). limits (logical) - If TRUE confidence intervals limits are displayed (default TRUE). legend (logical) add (TRUE) / remove (FALSE) plot legend (default FALSE). grid (logical) add (TRUE) / remove (FALSE) plot grid (default TRUE). ylog (logical) add (TRUE) / remove (FALSE) log scaling on y axis (default TRUE). ylab (character) label on y axis (default Ratio). ncol (integer) number of columns when facet = TRUE (default 4). fontsize (integer) Plot text font size. units (logical) Set units in axis labels (default TRUE). preferences (optional) preferences for plot display, run getPlotPreferences("plotBEConfidenceIntervals") to check available displays.
Value
-
A ggplot object if one parameter,
-
A TableGrob object if multiple plots (output of grid.arrange)
See also
Examples
initializeLixoftConnectors(software = "pkanalix")
project <- file.path(getDemoPath(), "2.case_studies/project_Theo_extravasc_SD.pkx")
loadProject(project)
runNCAEstimation()
runBioequivalenceEstimation()
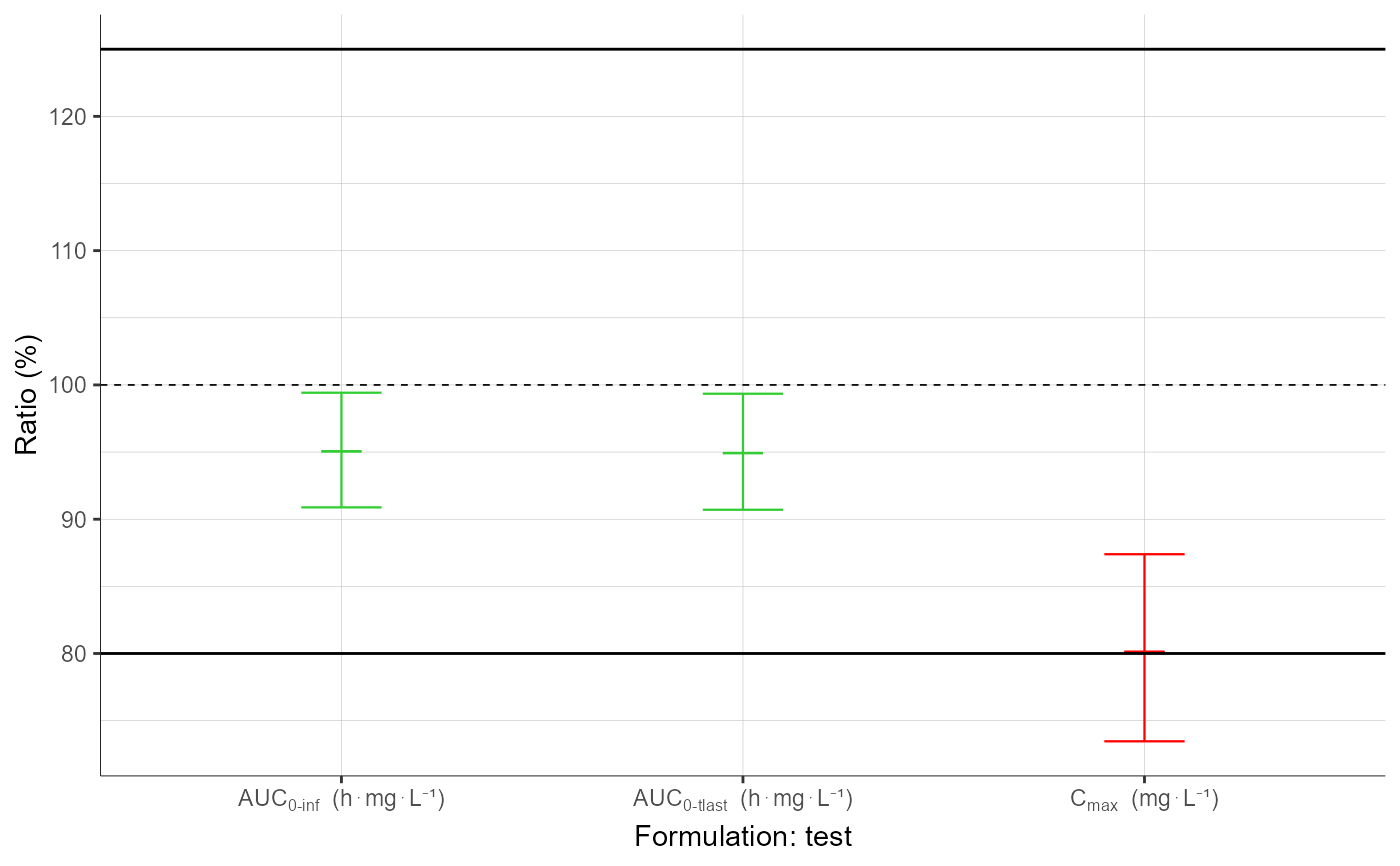
plotBEConfidenceIntervals()
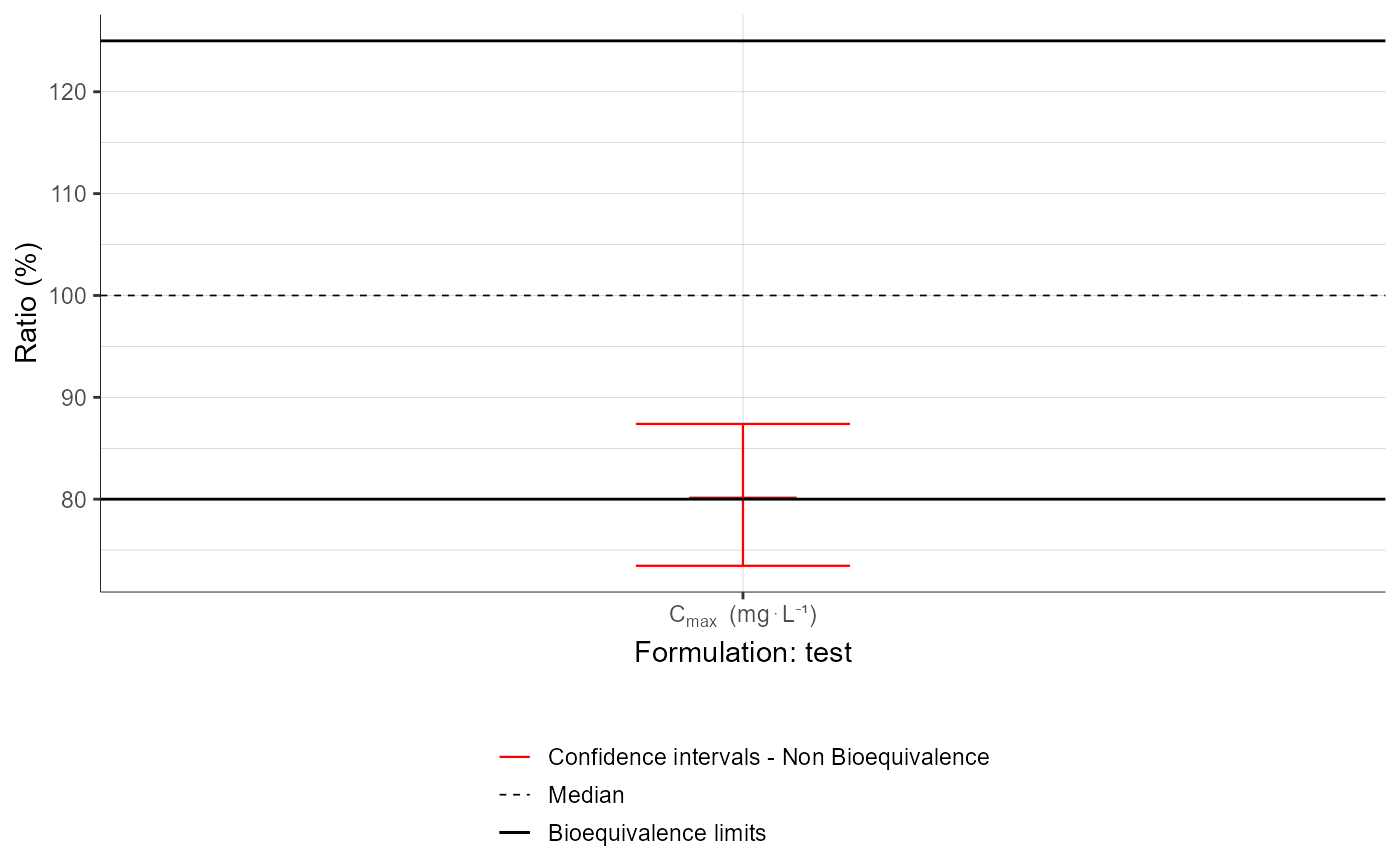
  plotBEConfidenceIntervals(parameters = "Cmax",
                            settings = list(legend = T))