Simulating and Evaluating Clinical Trial Designs for Pediatric Populations
This case study is for modelers designing pediatric PK trials. It shows how to use simulation and re-estimation to evaluate how precisely model parameters can be estimated with a given design. The step-by-step workflow helps ensure your trial collects data reliable enough for modeling and decision-making.
Introduction
Clinical trial design plays a crucial role in the development and estimation of population PK/PD models. In particular, the timing and frequency of concentration measurements directly impact the precision of parameter estimates, and thus the reliability of predictions made with these models.
Uncertainty of Population Parameters
Uncertainty of population parameter estimates is represented by standard errors. In Monolix, standard errors are calculated via the estimation of the Fisher Information Matrix. When applied to a single dataset (real or simulated), it provides an approximation of the uncertainty in parameter estimates for that specific dataset, or a specific realization of a clinical trial. it is used for:
Model diagnostics
Precision of parameter estimates
Confidence in simulation-based decisions
But, when evaluating a new clinical trial design the key question is:
“How variable would my parameter estimates be if I ran this trial multiple times, with different sampled patients, given this design?”
Calculating FIM, and standard errors, on one simulation doesn’t capture:
Random variation in patients covariates, e.g. weight distribution
Random sampling of individual effects (inter-individual variability)
Sampling noise due to residual error
So this approach is insufficient, and potentially misleading (overly optimistic), to analyse the variability of population parameter estimates between replicates of a clinical trial.
Clinical Trial Evaluation
When a trial is intended to support population PK/PD modeling, it can be designed with estimation precision in mind. The core question is:
“Given this design—dosing schedule, sampling times, number and characteristics of patients—how accurately and precisely can I estimate the model parameters?”
This helps ensure that the trial will yield data that are informative enough to support:
Reliable parameter estimation
Robust prediction
Informed decisions (e.g. dose selection)
Two main strategies are available for design evaluation:
Fisher Information Matrix (FIM) approach: This uses a first-order approximation around typical population parameters to calculate expected relative standard errors (RSEs). It is fast but relies on assumptions and approximations. The mlxDesignEval R package supports this approach.
Simulation-Estimation approach: This involves simulating multiple virtual clinical trials using the candidate design, followed by re-estimation of the population model for each replicate to assess uncertainty. While more computationally intensive, it provides unbiased results. This case study demonstrates this strategy.
Both methods require an existing candidate population model. Studies (e.g., Nyberg et al., Br. J. Clin. Pharmacol. 2015) show that they yield similar results.
Design optimization is especially critical in pediatric trials, where reducing the number of samples is essential to minimize burden while preserving informativeness.
Simulation-Estimation Approach
The workflow can be summarized in three steps:
Step 1: Simulate Many Trials Using the Proposed Design
Simulate Nrep replicates (e.g., R = 500) of the trial.
Each replicate has:
New randomly sampled individuals (covariates and random effects)
Same design structure (e.g., 4 samples at specific times, same dose groups)
Performed with
Simulx.
Result: Each simulated replicate mimics how a real clinical trial might look if conducted with this design.
Step 2: Estimate Parameters for Each Simulated Trial
For each replicate dataset, re-estimate the population parameters using
MonolixKeep only the estimated population parameters — no need to calculate SEs via FIM here.
Result: Nrep estimates per parameter (one from each replicate)
Step 3: Evaluate Variability of Parameter Estimates
For each population parameter :
Compute: Mean and Standard deviation
Compute: Relative Standard Error (RSE):
Result: This RSE represents how much parameter estimates fluctuate when the same design is applied multiple times.
Use Case: Pediatric Trial Based on an Adult PK Model
We start with a population PK model for warfarin in adults and adapt it to a pediatric population using allometric scaling. Key elements that can be optimized include:
Dosing regimen (scaled to weight)
Sampling times (limited to reduce burden)
Number of subjects and their covariates (e.g., weight)
The simulation-estimation workflow is performed using Simulx for trial simulation and Monolix for parameter re-estimation. Automation is handled via lixoftConnectors in R.
Workflow Overview
This documentation provides a step-by-step guide, with example steps/code to:
Simulate 100 replicates of a pediatric clinical trial using an adult PK model with allometric scaling.
Re-estimate population parameters for each replicate using the SAEM algorithm in Monolix.
Calculate relative standard errors for each population parameters across replicates.
Automate the entire process using R and
lixoftConnectors.
Setup in the GUI
We first show how to perform the simulation using the MonolixSuite GUI.
Warfarin Adult Model
A population PK model was developed using dense warfarin concentrations measurements in 32 healthy adults after a single dose. This model includes one-compartment with first-order absorption and linear elimination; and power law relationship between weight and V and Cl parameters.
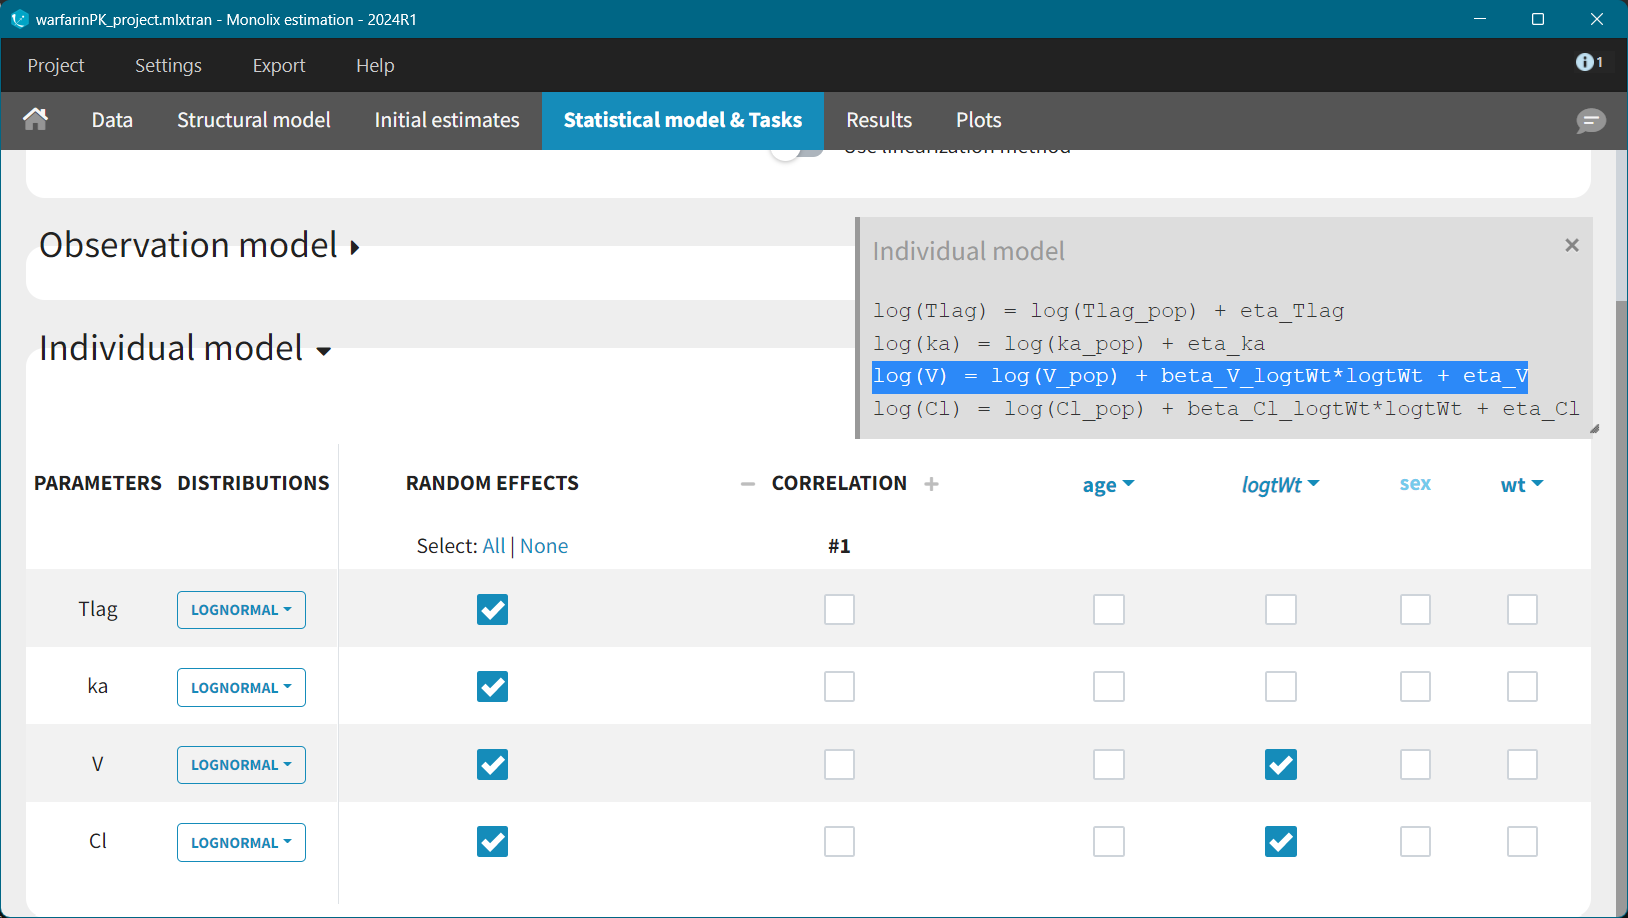
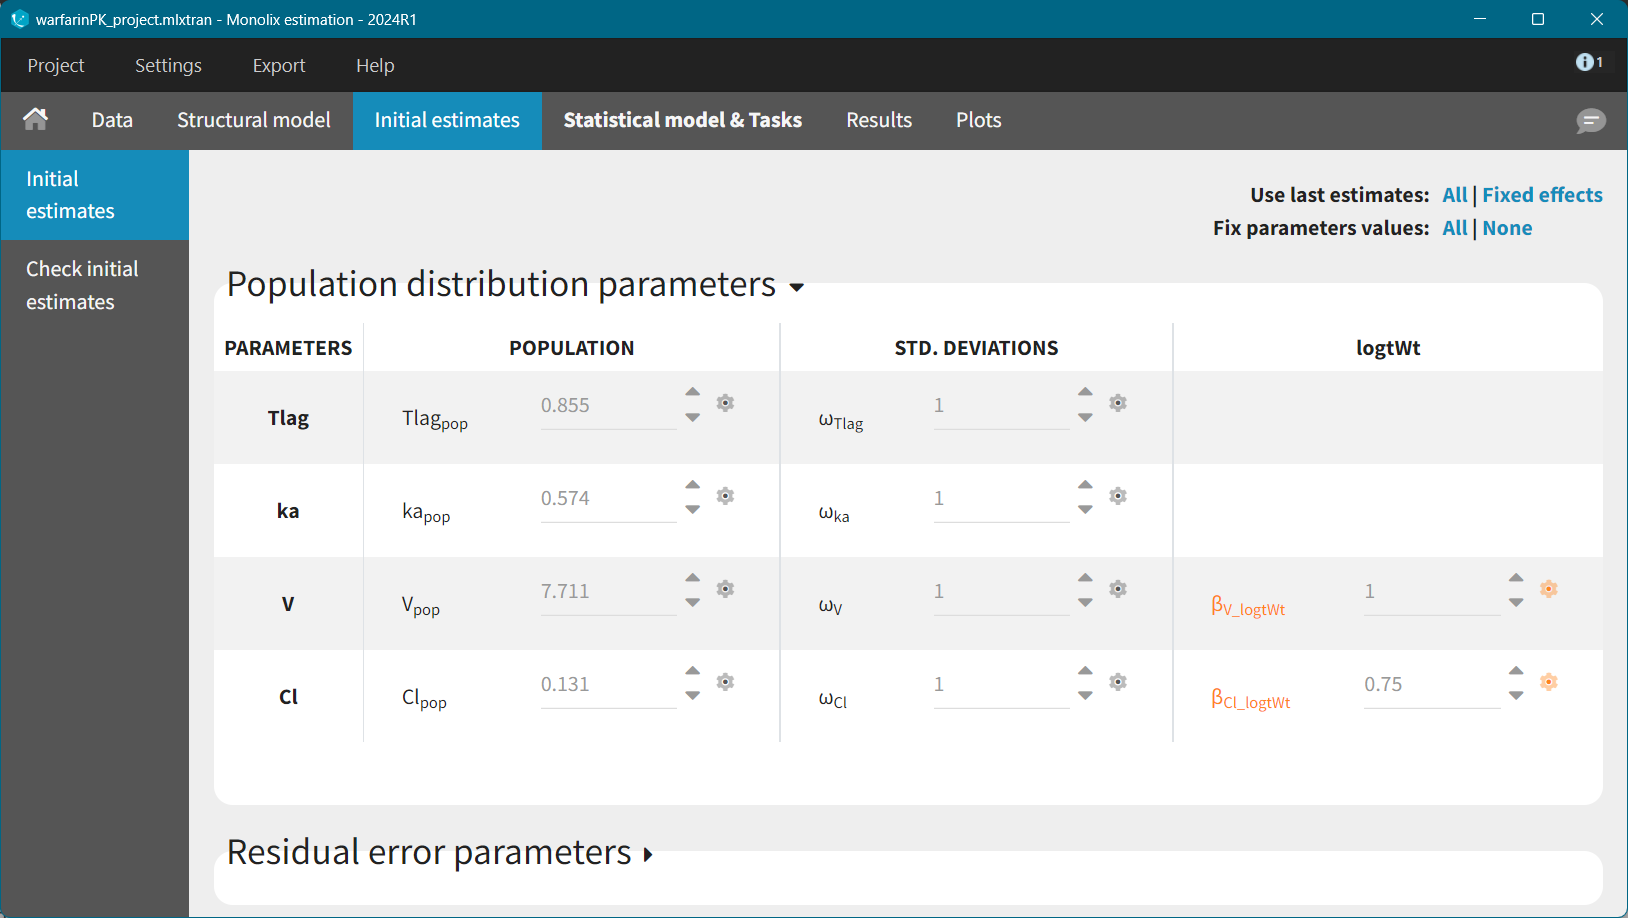
For allometric scaling of weight on the parameters V and Cl the “beta” parameters are fixed coefficients (1 for V and 0.75 for clearance). This can be done directly in the interface, in the Initial Estimates tab.
Export to Simulx
To build a simulation based on this model and estimated population parameters, export this Monolix project to Simulx using: Top Menu Bar >Export > Export Project to … > Simulx. Find here more details on the Export feature.
During export from Monolix to Simulx, it is possible to choose which covariates are transferred. Covariates included in the model are selected by default. When you start in Simulx, and import a Monolix project, then all covariates (present in the original dataset in the Monolix project) are transferred. This might not be convenient, because they might not be relevant but must be defined for a new simulation.
Note: Alternatively, the simulation can start in Simulx without using a Monolix project - create simulation from scratch. Refer to the documentation for more details.
Pediatric Trial Simulation in Simulx
Definition
Export of a Monolix project to Simulx sets up a model and simulation elements based on the dataset and the results. Some of these elements will be re-used directly, while some must be defined to represent a new design with a new population.
In pediatrics, doses are weight-adjusted, and typically grouped into ranges due to available tablet strengths. Based on the 0.2 mg/kg recommendation and available tablet strengths we consider three simulation groups:
WT 15–25 kg → 4 mg
WT 25–35 kg → 6 mg
WT 35–45 kg → 8 mg
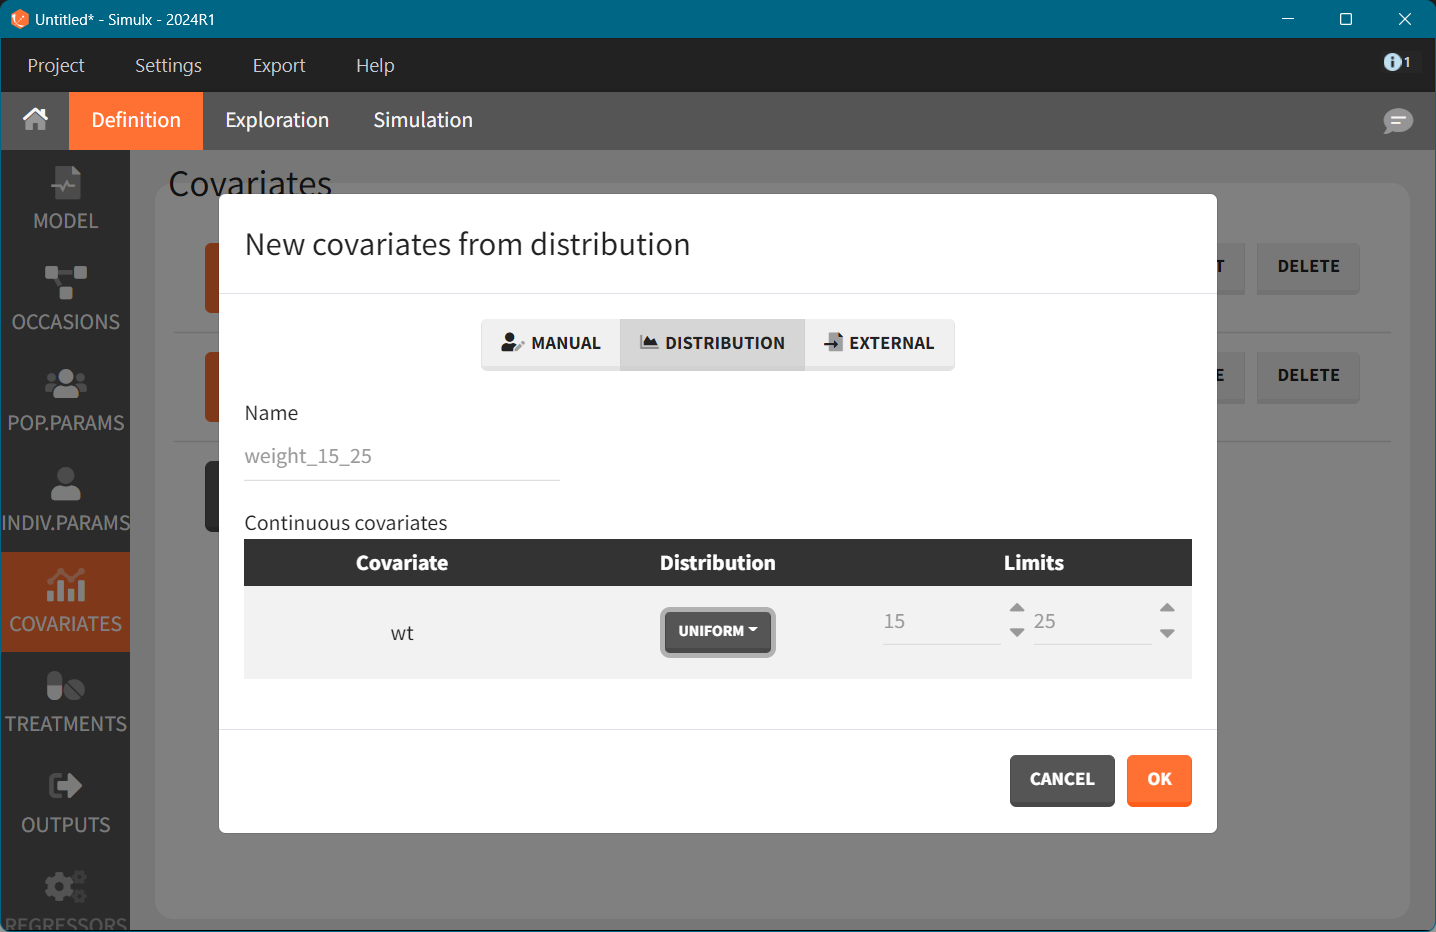
Covariate element. To simulate new individuals we can sample new weights from a distribution. The uniform distribution with limits according to the above weight groups will generate virtual patients with different weights for each simulation group. Using sampling from a distribution is convenient when we need to simulate many individuals. Alternative is to use an external file with a weight table, e.g. from a database. We create 3 covariate elements, one for each weight group.
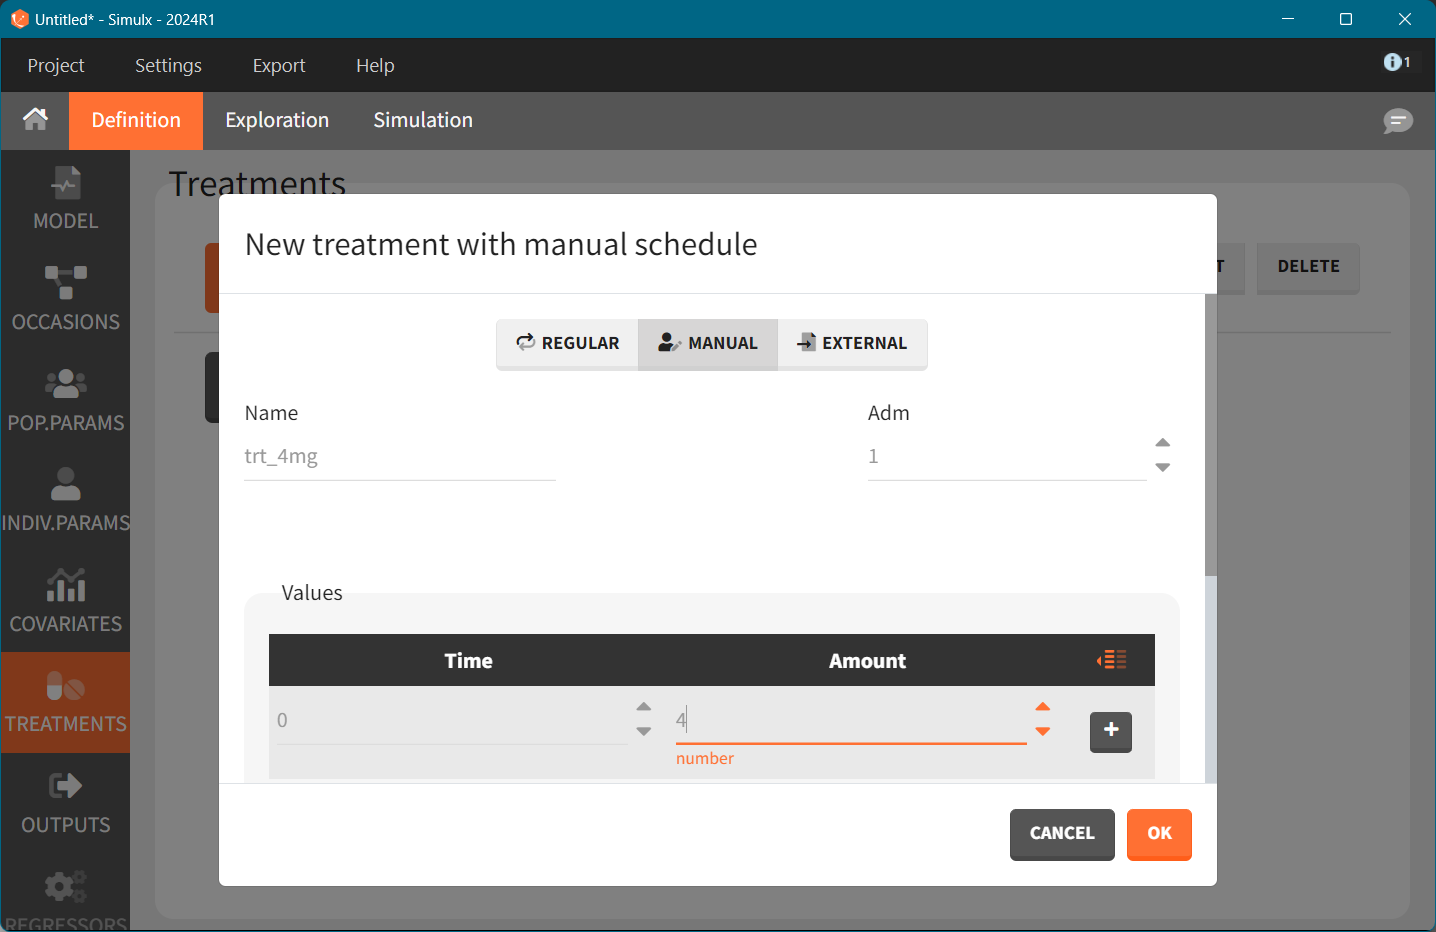
Treatment. Each dose group is represented by one treatment element with a single dose at time zero and a corresponding dose amount: 4mg, 6mg, and 8mg
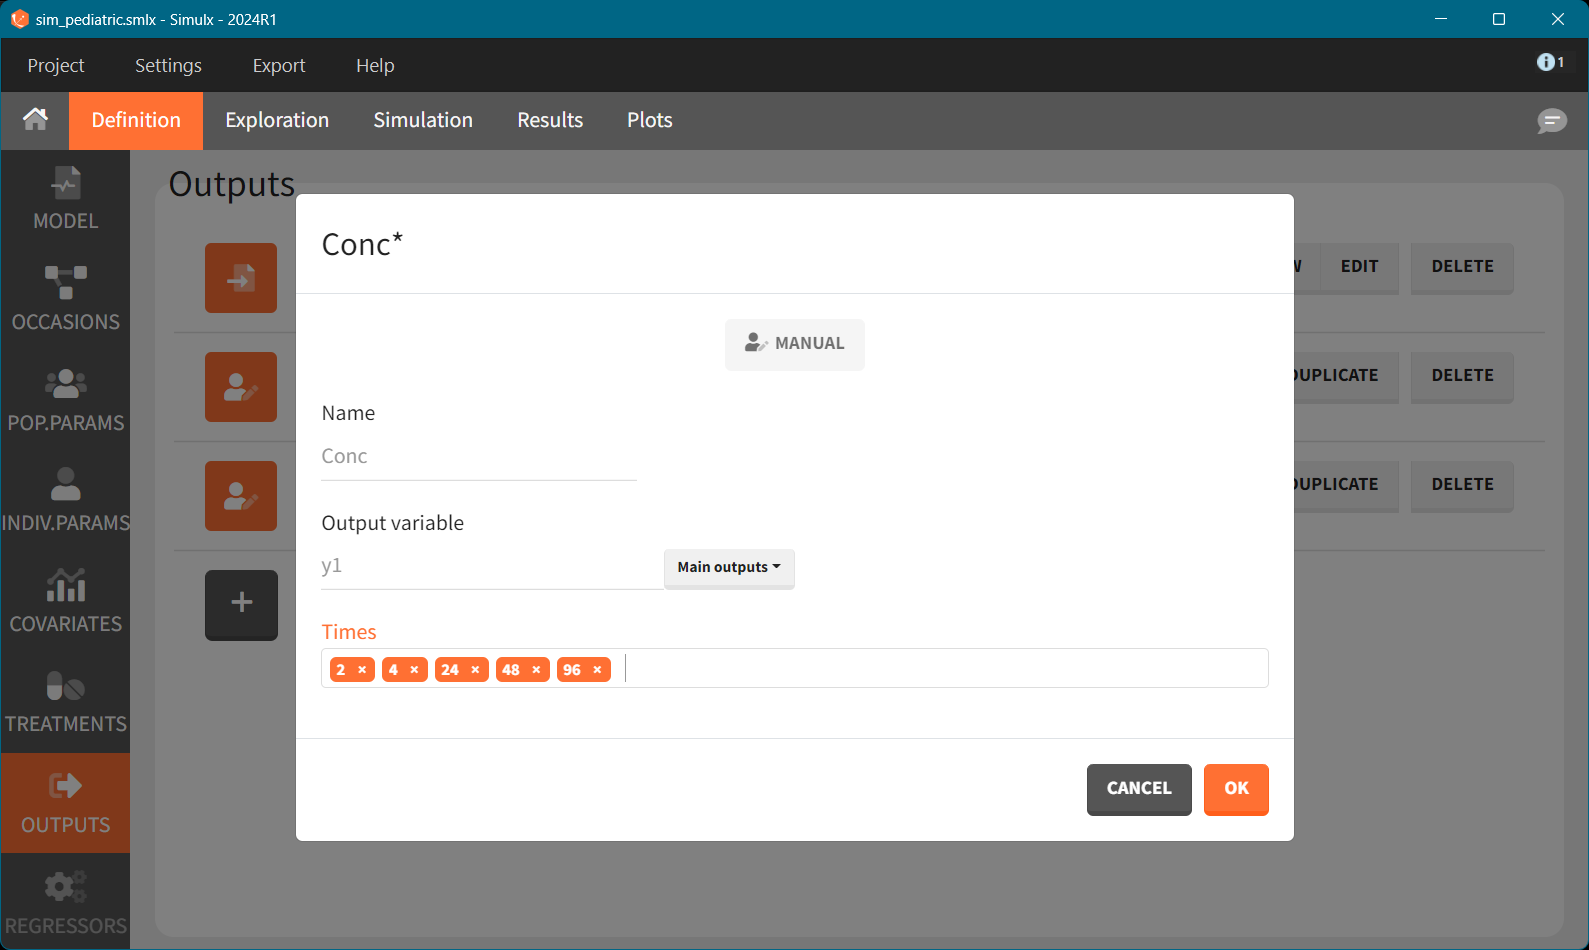
Sampling times. In adults, sampling occurred over 120 hours with dense measurements during the absorption phase (before 10 hours) and less frequent sampling thereafter. For the pediatric design, sampling is limited.
We can analyse how the number of measurements impacts the population parameter estimation. For example, compare 6 and 4 measurement points.
Because we simulate a real clinical trial, the output variable must include residual error - variable y1 is defined in the model in the DEFINITION section and is a sum of model prediction and residual error.
Simulation
Simulation scenario includes the following elements:
Three simulation groups based on weights
10 individuals per group
Parameters from Monolix project (mlx_pop with allometric scaling coefficients)
Covariate and treatment defined for each group
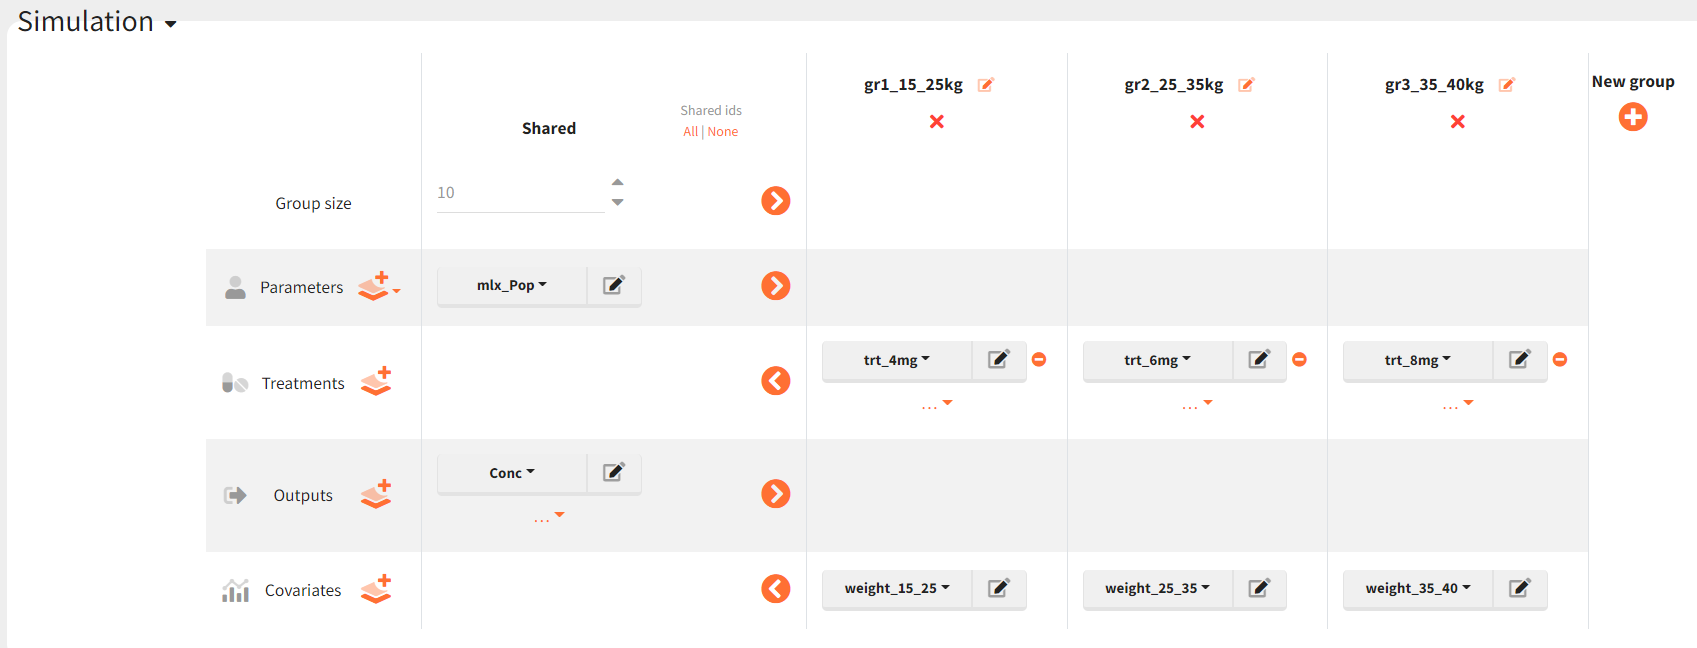
To simulate new individuals, Simulx first samples individual random effect, then covariates and then calculate individual parameters according the the individual model. Each group contains different individuals.
Replicates
As explained in the introduction, to evaluate a design, we repeat the simulation multiple times using replicates = 500.

Using mlx_pop as a parameter, each replicate uses the same population parameter. The individual parameters will differ between replicates. It is also possible to sample different population parameters for each replicate (e.g., mlx_popUncertain) to include the uncertainty of the adult model's estimation.
Running the simulation generates results as tables and plots. We will use the export feature to send the simulated values as formatted dataset back to Monolix.
Design Evaluation
The next step is the estimation of the population parameters for each simulated clinical trial. To do that, export simulated data from Simulx to Monolix: Top menu > Export to > … > Monolix. The exported dataset includes replicate (rep), individual (ID), and unique identifier (UID) columns, among others. The ID column repeats itself for each replicate while UID is unique across replicates.
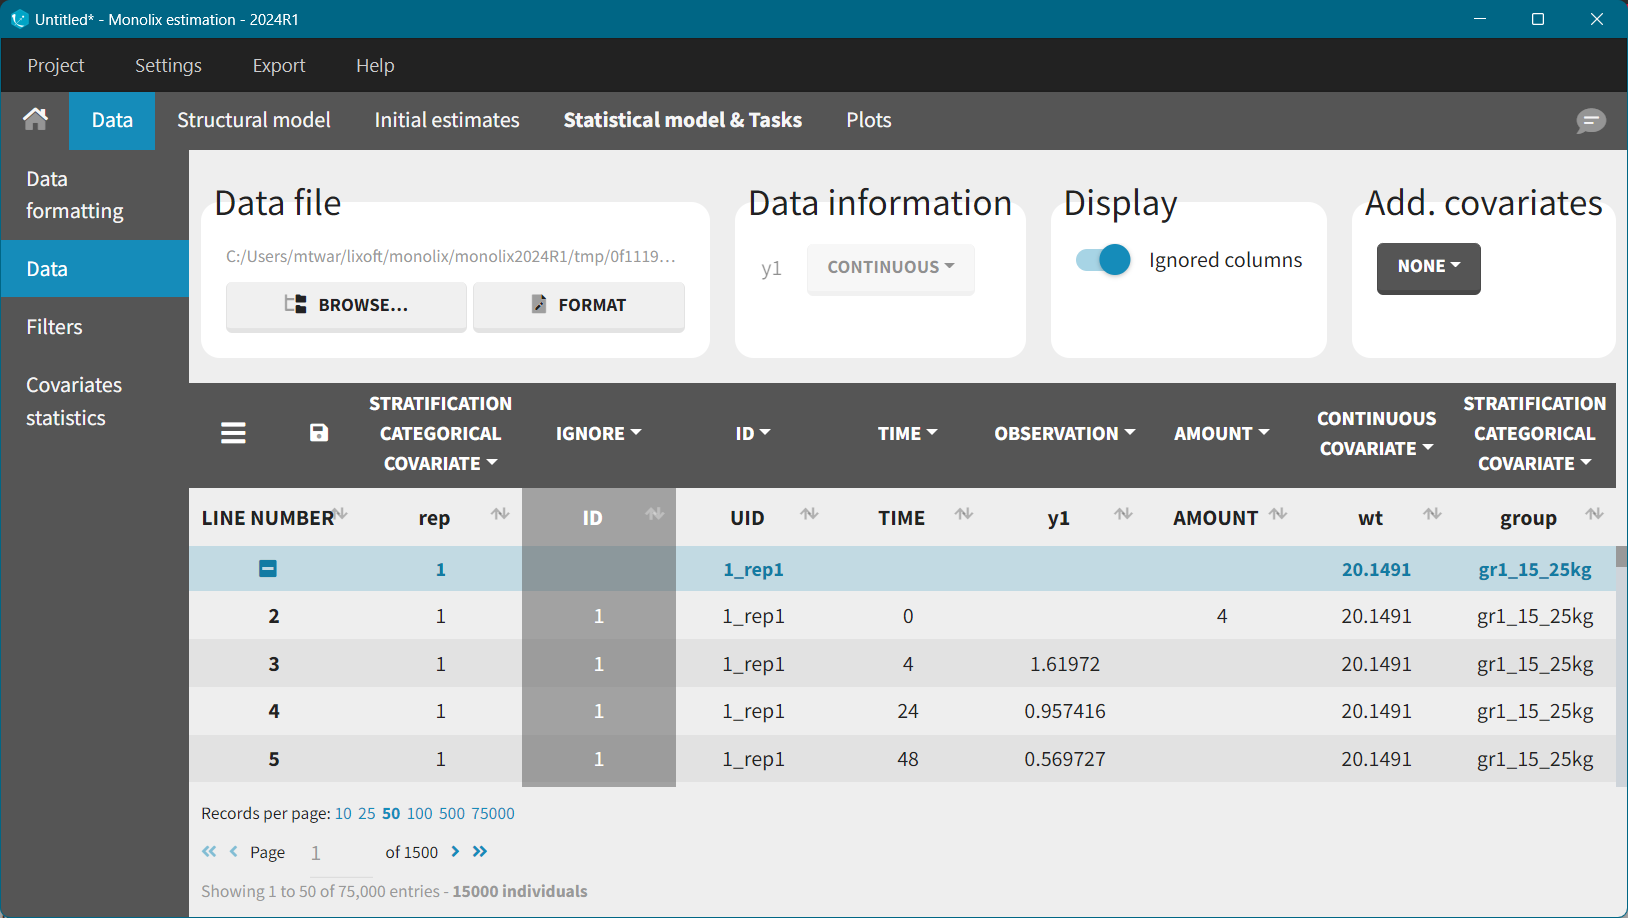
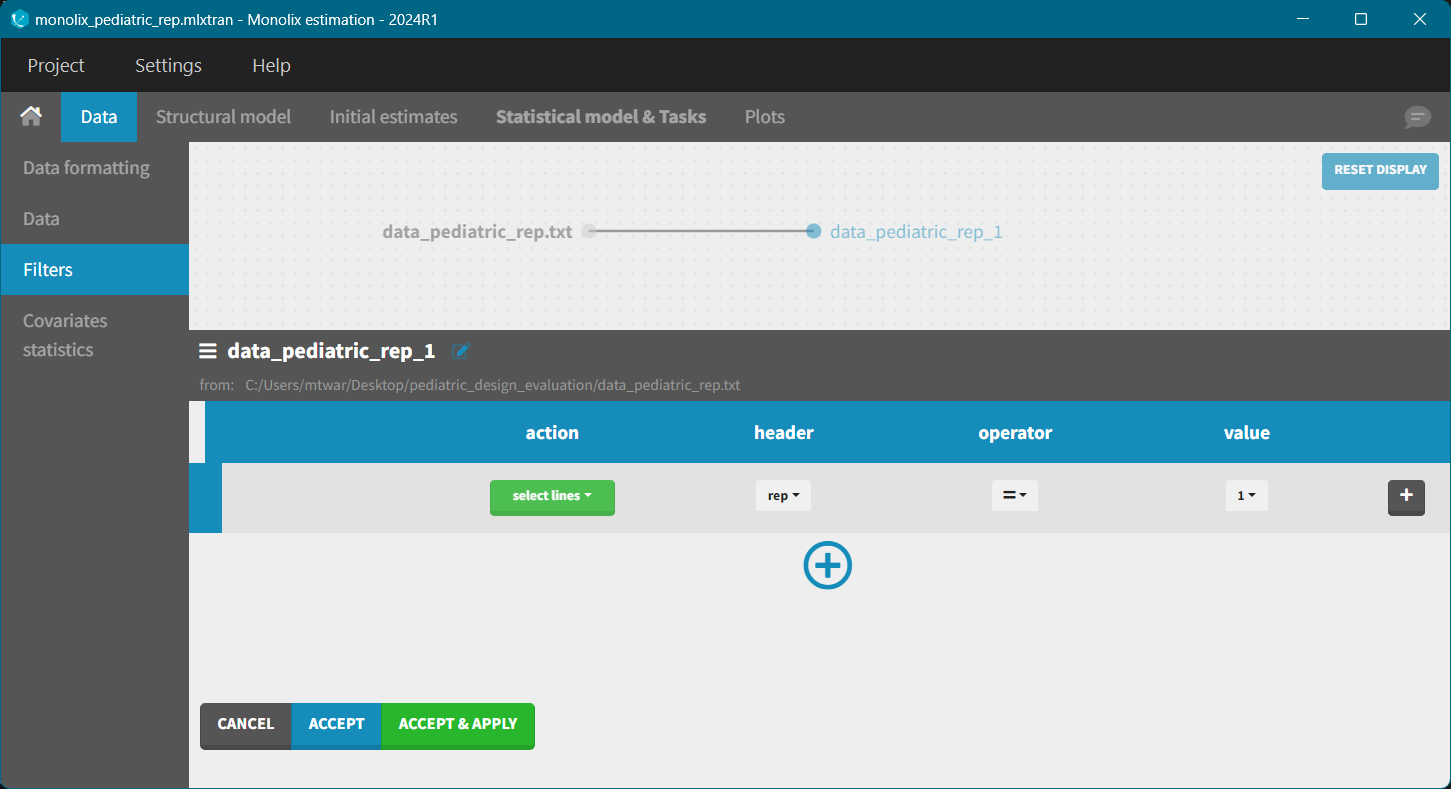
Estimation of population parameters is for each replicate independently. To do that, filters in Monolix create a subset for a specific replicate, e.g. select lines for which rep = k.
After the export, the imported structural and statistical model is set as in the Simulx project, while the initial estimates are equal to the population parameters used in the simulation scenario. Fix manually the beta parameters (allometric scaling coefficients) in the Initial estimates tab and run the parameters estimation task.
To asses the variability of population parameters estimates across replicates, the estimation task must be run for each replicate. Doing this manually is time-consuming and lixoftConnectors allow to automatize the workflow.
Automate the Workflow with lixoftConnectors
All steps of the simulation-estimation procedure in the GUI can be scripted in R using the lixoftConnectors R package:
Setup Simulation in Simulx:
Create a Simulx project with the model for adults (based on the Monolix project);
Define design (treatment, outputs) and covariates;
Set up a simulation scenario;
Save and Run simulation.
Export simulated data to Monolix and for each replicate:
Filter data with “select lines with rep=n”;
Run estimation of parameters.
Post-processing:
Compute RSE of parameter estimates across replicates
Plot the results
Next section describes the above steps in detail, including the R code.
R-script
Initialization
The script first load the lixoftConnectors library and other libraries used for post processing and plotting of result. The initialization communicates to R which software to connect with.
We start in Monolix and then switches to Simulx, and again back to Monolix. Option “force = T” means that the switch is done without asking for confirmation.
library(lixoftConnectors)
initializeLixoftConnectors(software = "simulx", force = T)
library(ggplot2)
library(dplyr)
Then set simulation variables, load a Monolix project and export it to Simulx. The R seed is used in the covariate sampling only. It is fixed to assure the reproducibility of results.
# 0. Pre - Simulation settings
set.seed(123) # R seed for sampling of covariates
Ngr <- 10  # group size
Nrep <- 100 # number of replicates
N <- Ngr*Nrep # size of a table with covariates

# 1. Import a Monolix project

loadProject("warfarinPK_project.mlxtran")
pop_param_adult <- getPopulationParameterInformation()

# 2. Export Monolix project to Simulx
exportProject(settings = list(targetSoftware = "simulx"), force = TRUE)
Population parameters values are first transferred from the Monolix project with the adult model to Simulx, and then from simulation of a new trial design to Monolix for estimation. However, information that parameters are fixed (e.g. beta) is not transferred. In the above code, the variable pop_param_adults stores the full information about population parameter and will be used to re-set it in the Monolix project used for the re-estimation of parameters.
Definition
When using the lixoftConnectors, it is not possible to define a covariate element of type “distribution” as we have done inthe GUI. Instead, we will generate a table of weight values and provide them as externalf ile to Simulx. Thus, the weight covariate is sampled from the uniform distribution using R-function runif. It creates a dataframe, which cannot be used directly in Simulx. It must first be saved as a csv file. The covariate element is then defined using this file.
# Define covariates for each weight group
samples_wt <- data.frame(id=1:N, wt = runif(N, min=15, max = 25))
write.csv(samples_wt, file="cov.csv", row.names = FALSE)
defineCovariateElement(name = "wt_15_25", element = "cov.csv")
(The same must be repeated for interval 25-35 kg and 35-40 kg.)
In the simulation, Simulx will sample values from this table, cov.csv. The size of the table must be large enough to include sufficient weight variability between replicates. This table can contain as many individuals as required in the simulation, e.g. nb. groups * group size * nb. replicates, and then we can sample from this table with or without replacement. If the size is smaller, than sampling must be with replacement.
Avoid sampling using the “keep order” method, because in this case the sampling for each replicate will start from id=1. It means that patients weight will be identical across replicates. Changing the sampling method will be shown later.
Treatment is defined as in the GUI, with three elements - one for each dose level.
# Define a treatment element for 4, 6 and 8 mg once daily
defineTreatmentElement(name="4mg", element=list(data = data.frame(time=c(0), amount = c(4))))
defineTreatmentElement(name="6mg", element=list(data = data.frame(time=c(0), amount = c(6))))
defineTreatmentElement(name="8mg", element=list(data = data.frame(time=c(0), amount = c(8))))
In Simulx it is also possible to define covariate scaled treatment, e.g weight-based dosing such as 0.2mg/kg. However, in this case, due to the available table strengths, we round the dose amounts based on the weight group.
Output element contains specific measurement times that characterize a design:
# Define an output element to capture concentration over time
output <- defineOutputElement(name = "Conc", element = list(data = data.frame(time = c(1, 4, 8, 12, 24, 48)), output = "y1"))
By default, a simulation contains one simulation group with a default name. The code below changes this default name to a more meaningful one, sets simulation elements, and adds two more groups with appropriate covariate and treatment element.
# Combine these elements into the simulation scenario
getGroups()

renameGroup("simulationGroup1","gr1_15_25kg")
setGroupSize("gr1_15_25kg", Ngr)
setGroupElement("gr1_15_25kg", elements = c("mlx_Pop",
                                        "4mg",
                                        "Conc",
                                        "wt_15_25"))
addGroup("gr2_25_35kg")
setGroupSize("gr2_25_35kg", Ngr)
setGroupElement("gr2_25_35kg", elements = c("mlx_Pop",
                                            "6mg",
                                            "Conc",
                                            "wt_25_35"))
addGroup("gr3_35_40kg")
setGroupSize("gr3_35_40kg", Ngr)
setGroupElement("gr3_35_40kg", elements = c("mlx_Pop",
                                            "8mg",
                                            "Conc",
                                            "wt_35_40"))
Then, add replicates and sampling method, save and run simulation
# Define a simulation with replicates. Elements from tables sampled without replacement
setNbReplicates(nb = Nrep)
setSamplingMethod(method = "withoutReplacement")

# Save the simulation scenario and run calculation
saveProject(projectFile="sim_pediatric_fromR.smlx")
runSimulation()
Export simulation results to Monolix:
# 4. Export simulation results to Monolix
exportProject(settings = list(targetSoftware = "monolix", filesNextToProject = T, dataFilePath = "data_pediatric_manyObsPoints.csv", modelFileName = "model_warfarin.txt"), force=T)
saveProject(projectFile="pediatric_sim_designComparison.mlxtran")
and update information of population parameters (fixed beta) using the previously defined variable
# 5. Run estimation of population parameters and calculation of standard errors for each replicate
setPopulationParameterInformation(pop_param_adult)
saveProject(projectFile="pediatric_sim_design.mlxtran")
Initialize data frames with results and run estimation for each replicate:
# Selection of relevant parameters
param_names <- pop_param_adult$name
exclude_params <- c( "a", "b", "c")
param_names <- setdiff(param_names, exclude_params)
param_names <- param_names[!grepl("beta", param_names)]

# Initialize results
results <- as.data.frame( matrix(nrow = Nrep, ncol = length(param_names), dimnames = list(c(1:Nrep), param_names)) )

# Estimate parameters for each replicate
for (k in 1:Nrep) {
  # Filter the data to include only the current replicate
  applyFilter(filter = list(selectLines = paste0("rep==", k)),name="one_rep")
  saveProject(projectFile = "temp.mlxtran")
  # Set scenario
  myScenario <- getScenario()
  myScenario$tasks = c(populationParameterEstimation = TRUE)
  setScenario(myScenario)

  # Run parameter estimation for the current replicate
  runScenario()

  # Get population parameters estimates
  pop_results <- getEstimatedPopulationParameters()

  # update the results
  results[k, ] <- pop_results[param_names]

  removeFilter()
  deleteFilter("one_rep")
}
In the post-processing step calculate mean standard errors and confidence intervals for each parameter
# 6. Plot the results
# Calculate mean and sd for each parameter
summary_stats <- data.frame(
  parameter = colnames(results),
  mean = sapply(results, mean, na.rm = TRUE),
  sd   = sapply(results, sd, na.rm = TRUE)
)

# Calculate RSE (%) = 100 * sd / mean
summary_stats$RSE_percent <- 100 * summary_stats$sd / summary_stats$mean

summary_stats$parameter <- factor(summary_stats$parameter, levels = summary_stats$parameter)

ggplot(summary_stats, aes(x = parameter, y = RSE_percent)) +
  geom_bar(stat = "identity", fill = "steelblue") +
  #coord_flip() +  # Flip for readability if you have many parameters
  labs(
    title = "Relative Standard Errors (RSE) per Parameter",
    x = "",
    y = "RSE (%)"
  ) +
  theme_minimal()
Example
We compare the impact of the measurement times on the uncertainty of population parameters estimates (i.e their variability across replicates). The clinical trial design shown on the left below uses 6 measurements at times 1, 3, 8, 12, 24, 48 hr, while second has only four at times: 2, 4, 12, 48 hr (on the right). We expect that in the second case, the RSE for parameters related to the absorption process will be higher. The question is: are they acceptable?
The simulation uses 20 individuals per group, and 100 replicates.
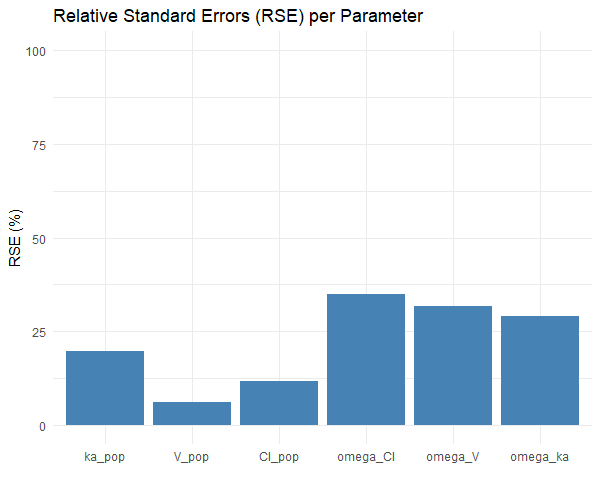 | 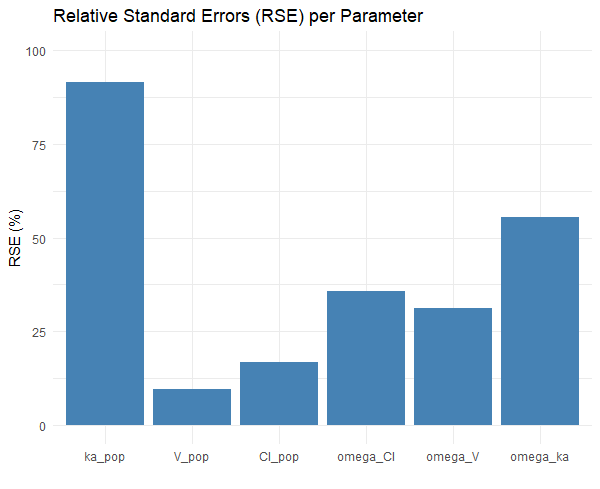 |
The plots shows:
Reducing the number of sampling points weakens the ability to estimate ka.
With only 4 points at times 2, 4, 12, 48hr, the data no longer provide enough information about the absorption phase, where ka influences the concentration-time profile the most.
The design with 6 points at time 1, 3, 8, 12, 24, 48 hr better captures the absorption phase, helping Monolix distinguish between absorption and elimination processes more clearly.
An RSE of 70% for ka indicates that different trials with the same design would give very different estimates of ka. It's likely not precise enough to rely on for decision-making. Design with 6 points is much more robust for identifying ka, and may be worth the additional burden, especially if ka is clinically relevant (e.g., for bioequivalence, peak-related effects, or modeling absorption delays).
