Modeling of Tisagenlecleucel CAR-T cells
In this case study, we show how Monolix is used to develop a model for the kinetics of tisagenlecleucel and the impact of therapies for treating cytokine release syndrome (tocilizumab and corticosteroids) on expansion.
This case study is based on the model and the simulated data published in:
Stein, A. M., Grupp, S. A., Levine, J. E., Laetsch, T. W., Pulsipher, M. A., & Boyer, M. W. (2019). Tisagenlecleucel Model- Based Cellular Kinetic Analysis of Chimeric Antigen Receptor – T Cells. 2019, 285–295. https://doi.org/10.1002/psp4.12388
All the files from this case study can be download here: Monolix_runs_CART_case_study.zip
Introduction to CAR-T cells
Chimeric antigen receptor (CAR)–T cell therapy involves the adoptive transfer of autologous T cells genetically modified to facilitate antigen-specific cell killing through endogenous effector cell mechanisms of cytotoxicity.
CAR- T cells undergo rapid expansion several logs beyond the infused cell dose and demonstrate long-term persistence that does not follow typical models of metabolism and clearance. Therefore, the cellular kinetics of CAR- T cells cannot be described by classical pharmacokinetics (PK). Instead, population PK models characterizing CAR-T typically follow three phases:
Following infusion, widespread distribution into various tissues occurs within a few hours.
During the next several days, increases in the CAR-T cells copy number reflect exponential growth, whereby the binding to its target antigen induces the killing of the target cell and stimulates proliferation of the CAR-T cells.
After the time of maximal expansion (Tmax) is reached, the kinetics of the CAR-T cells expansion are followed by a biexponential decline. The initial contraction occurs at a rapid rate and is thought to correspond to programmed cell death of activated CAR- T cells. The second phase of decline occurs more gradually over time and corresponds to the persistence of CAR-T cells that demonstrate an immune memory phenotype.
Introduction to tisagenlecleucel
Tisagenlecleucel is a chimeric antigen receptor–T cell therapy that facilitates the killing of CD19+ B cells. It produces durable responses in pediatric and young adult patients with relapsed or refractory B cell acute lymphoblastic leukemia (r/r B- ALL).
Dataset
The published model is used to capture tisagenlecleucel levels measured in 90 patients. The initial dataset has been pooled from two phase II studies in pediatric (61 patients) and young adult (29 patients) relapsed/refractory B cell acute lymphoblastic leukemia. For this case study we use the dataset provided in the Supplementary Material and simulated from the model.
A screenshot showing an extract of this dataset loaded into Monolix is shown here:
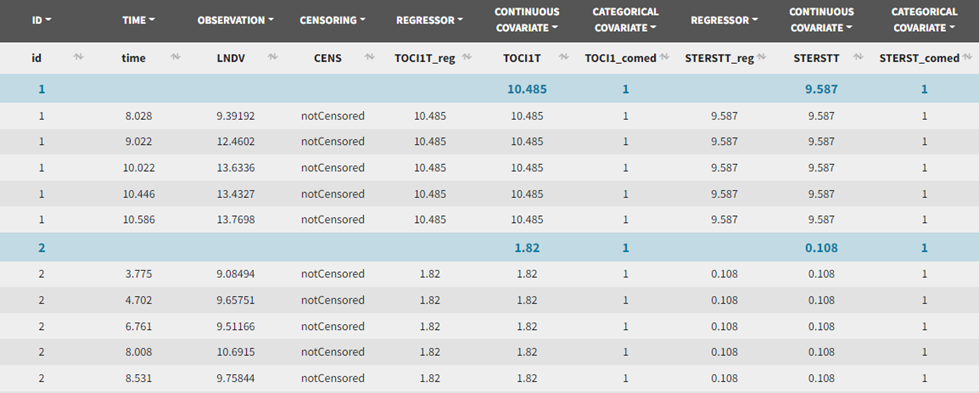
The patients received a single dose of tisagenlecleucel each. This dose is not reported in the dataset.
Samples in the LNDV column correspond to log-transformed tisagenlecleucel levels reported as transgene copies/μg of genomic DNA. Censoring is indicated in the CENS column and the limit of quantification was 10 copies per reaction (≈ 50 transgene copies per μg of genomic DNA).
Although the dataset used in the paper includes several covariates, only covariates for comedications of tocilizumab or corticosteroids are included in the simulated dataset used for this case study, both as binary variables and as continuous variables corresponding to the time of the first dose for the patients who received each treatment:
TOCI1T_reg: time of first comedication of tocilizumab, to be used as regressor.
TOCI1T: time of first comedication of tocilizumab, to be used as continuous covariate.
TOCI1T_comed: 1 for individuals that have received comedication of tocilizumab, 0 for individuals that have not, this column is tagged as categorical covariate.
STERSTT_reg, STERSTT and STERSTT_comed are similar columns but for corticosteroids instead of tocilizumab.
The data can be explored in Monolix via the interactive Observed data plot. Below we show the plot with all subjects, and a few representative individual profiles:
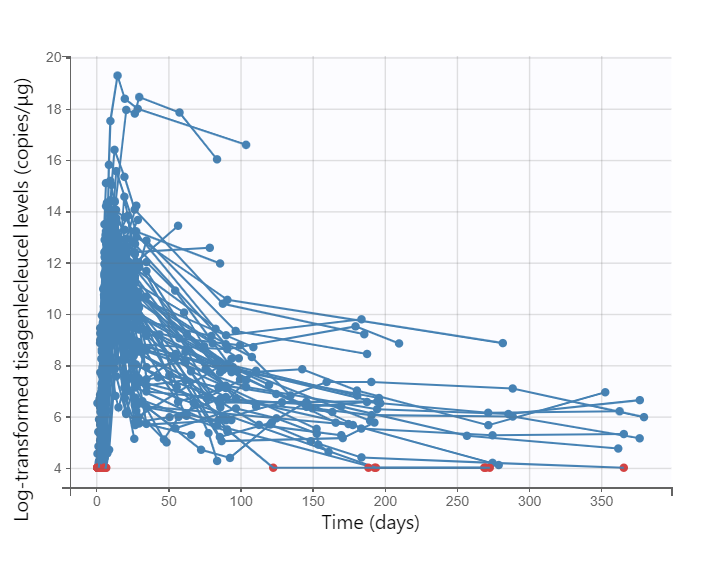

Representative individual profiles (subjects: 65, 66, 67, 3). Y-axis: Log-transformed tisagenlecleucel levels (copies/μg), X-axis: Time (days)
The covariate viewer plot allows to visualize the distributions of the comedication covariates. In the figure below, histograms on the left and center display times of comedication (left figure for tocilizumab, middle figure for corticosteroids). Bars on the barplot on the right correspond to the number of subjects receiving comedications, from left to right: no comedication, tocilizumab only, corticosteroids only, or both.
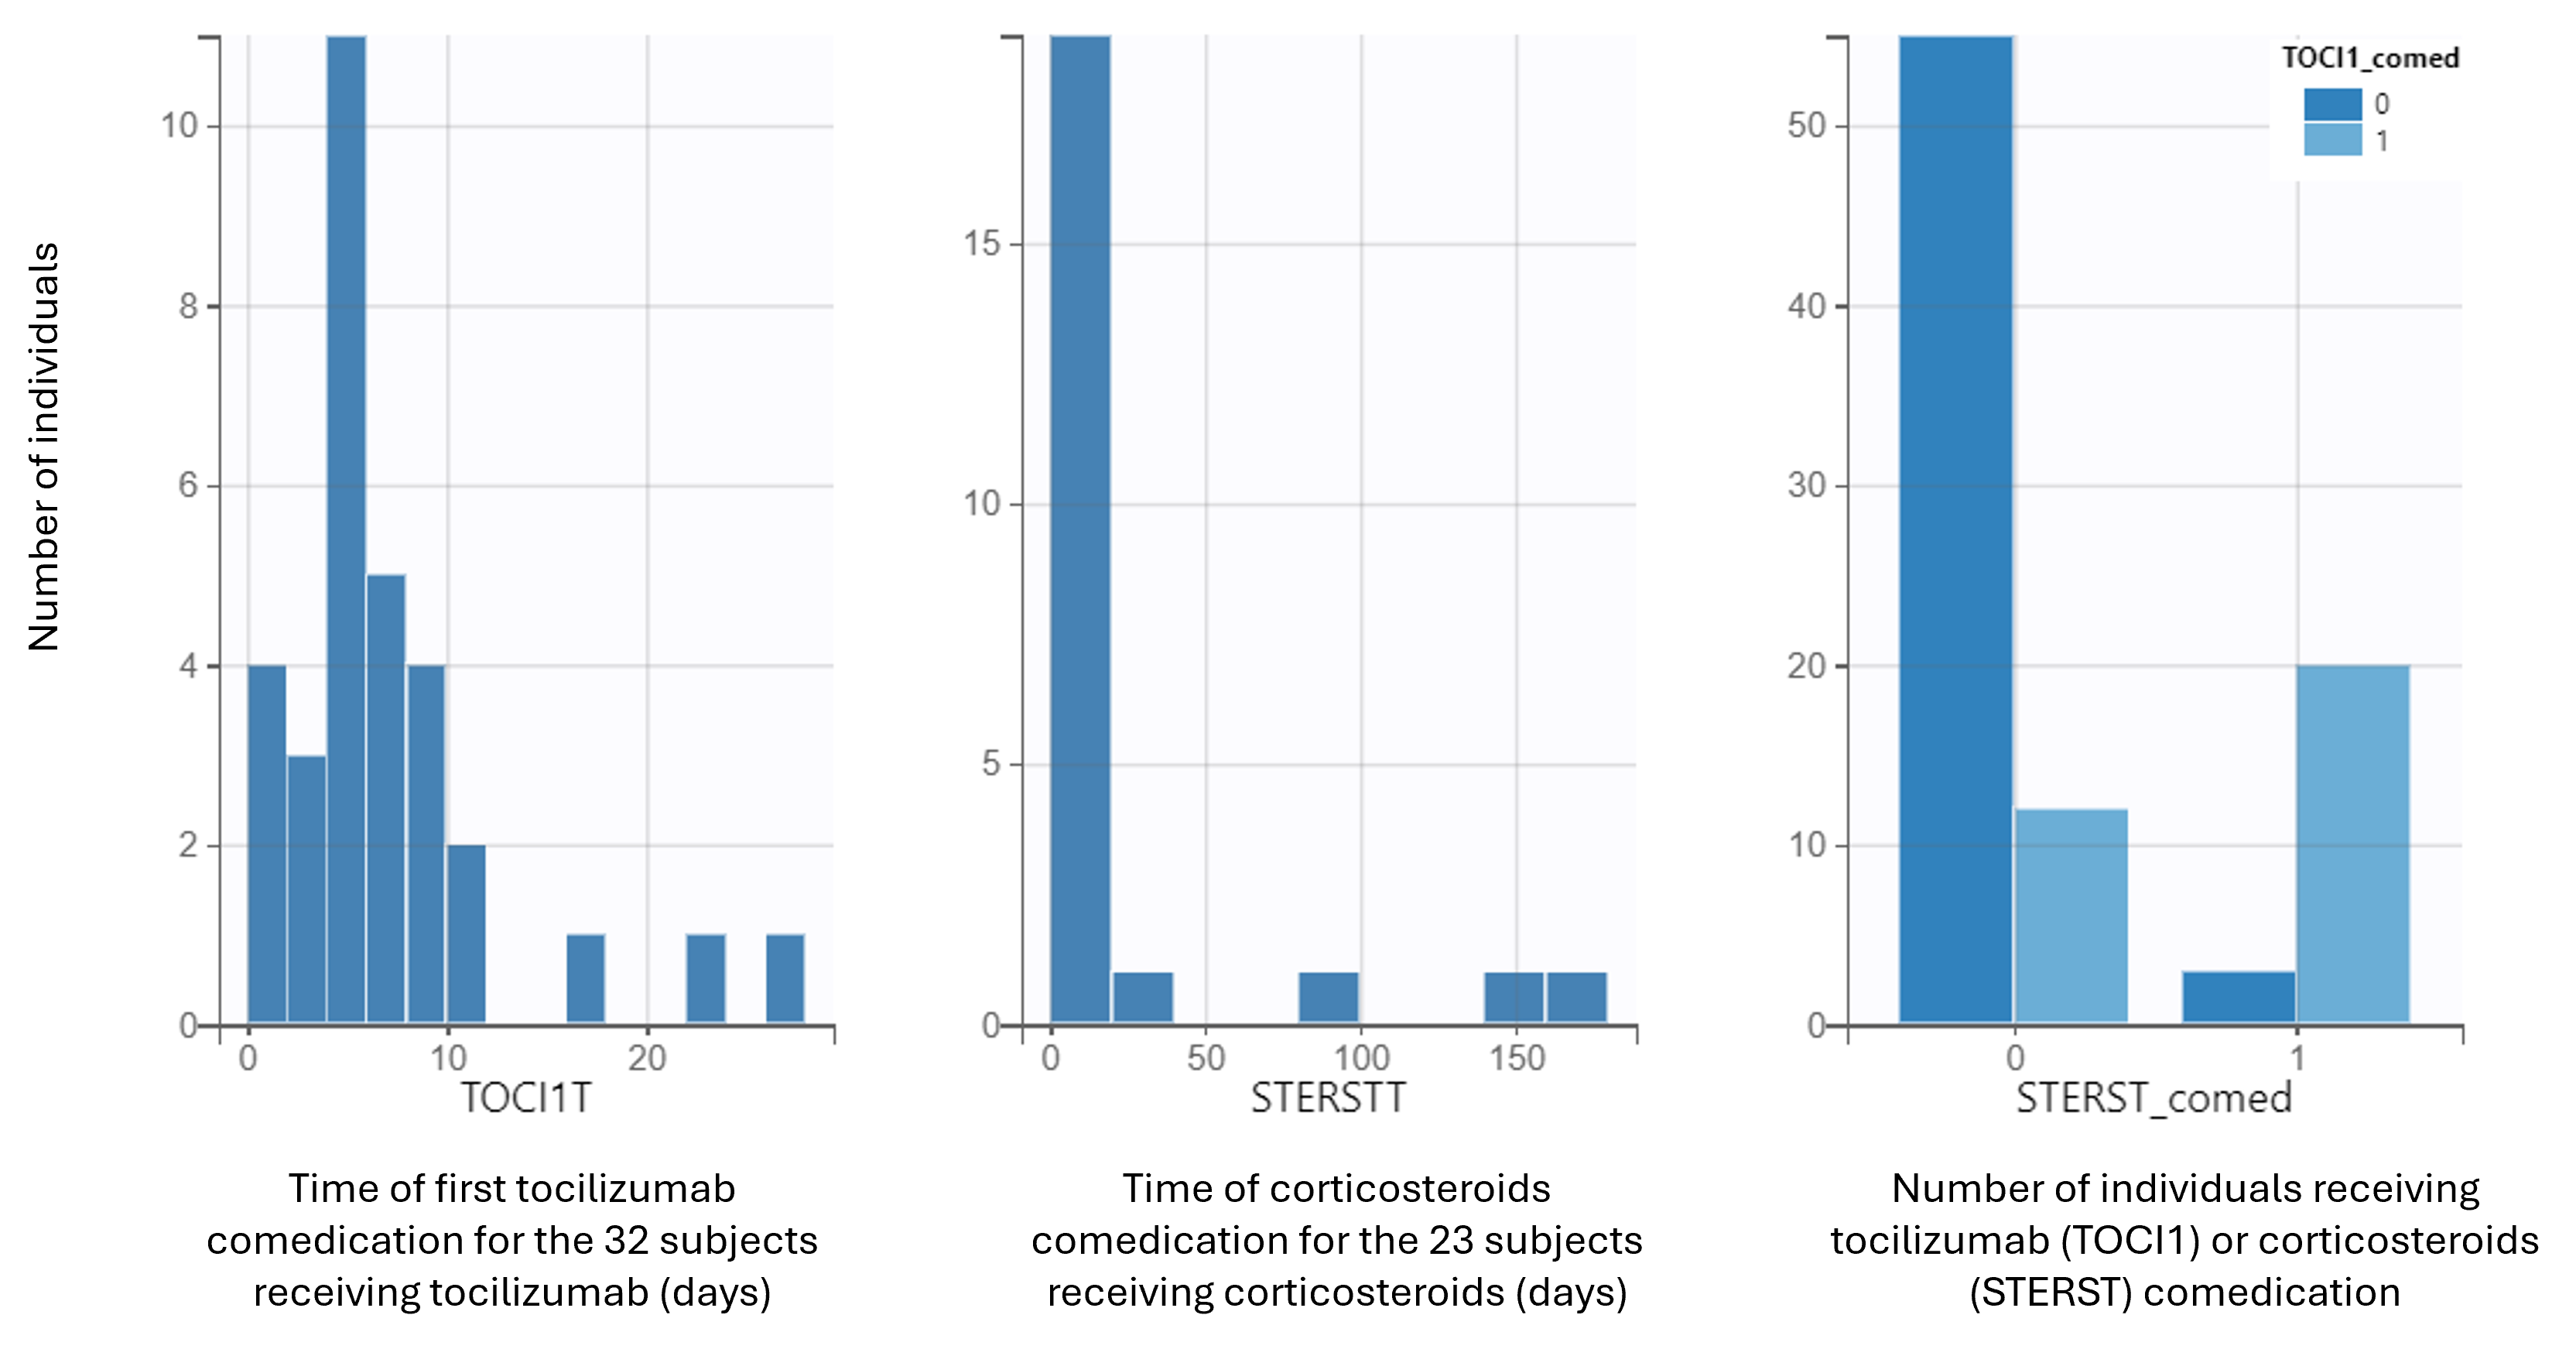
We see that 55 individuals received no comedication, 20 received both and 15 individuals received one or the other.
Structural model
We evaluate two structural models on this data, both used in the paper, and whose typical profiles are shown on the figure on the right:
The base structural model captures the exponential expansion of tisagenlecleucel, followed by biexponential contraction.
The second model includes an extension for comedication effect of tocilizumab and corticosteroids, used to mitigate toxicity associated with tisagenlecleucel activation, on tisagenlecleucel expansion.
Both models are described in more details further below.
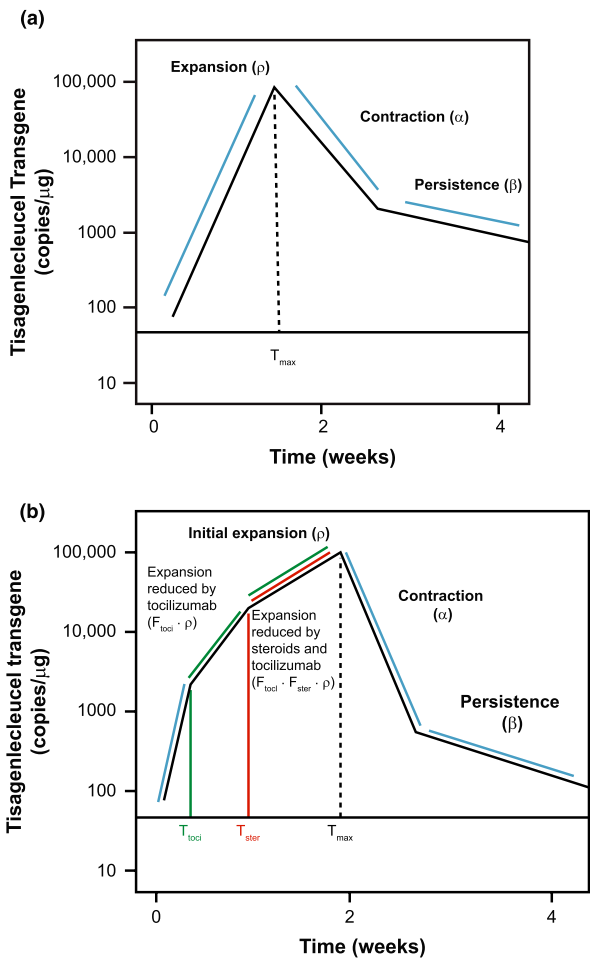
Figure 1 from Stein, et al. (2019).
Base structural model
This model was initially developed to describe profiles of lymphocyte kinetics and corresponds to the compartmental model displayed below:
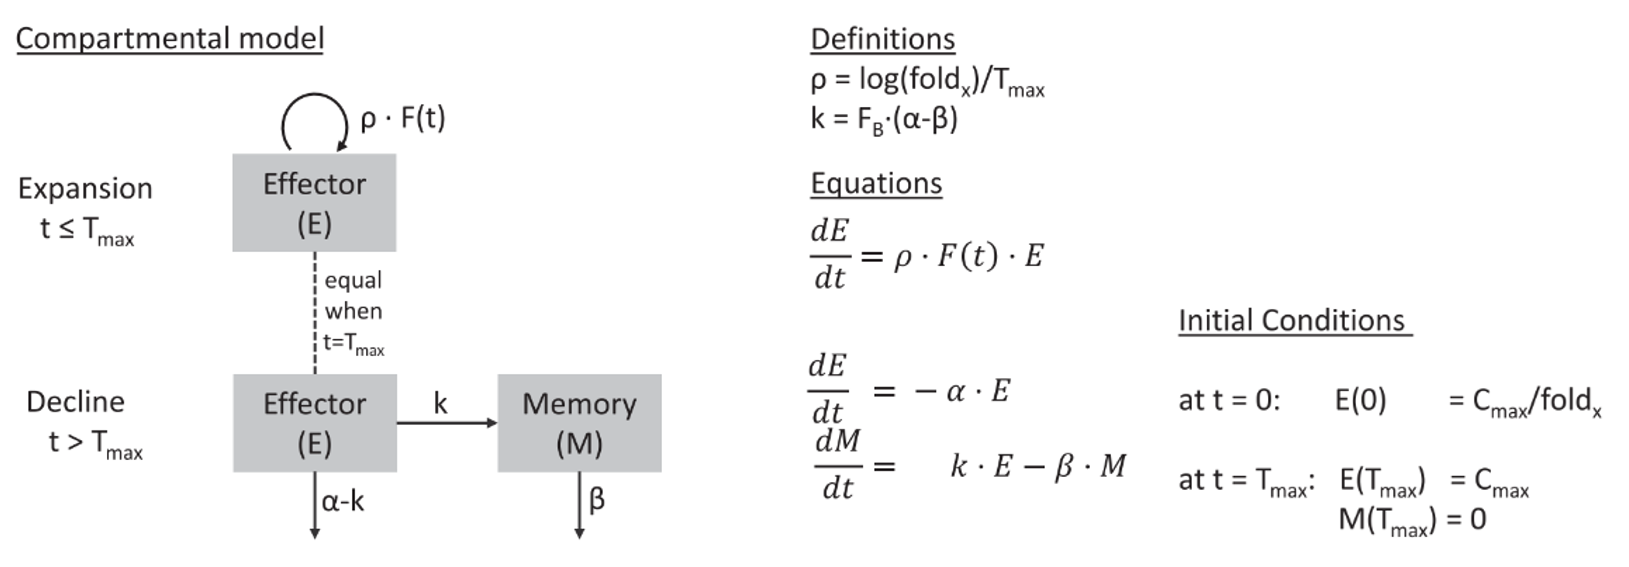
Figure 2 from Stein, et al. (2019).
It captures the exponential expansion of tisagenlecleucel with rate constant ρ up to time Tmax, followed by biexponential contraction after Tmax with rate constants α and β. The α slope corresponds to a rapid contraction as a result of the programmed apoptosis of most activated lymphocytes following the initial immune response, and the β slope corresponds to a gradual decrease of T cells that can persist in the body for years or even decades.
The model has the following six parameters: Cmax, Tmax, foldx, FB, α, and β. Cmax is the maximum transgene copies of tisagenlecleucel that occurs at time Tmax; foldx is the fold expansion of tisagenlecleucel from baseline and linked to the expansion rate ρ with ρ = log(foldx)/Tmax. FB describes the fraction of transgene copies present at peak expansion (Tmax), which declines with gradual rate constant β, and (1 − FB) is the fraction of transgene copies present at peak expansion, which declines with the rapid rate constant α.
It is also described by these equations:

where the terms R0, A, and B in the equations were computed as follows to ensure continuity: R0 = Cmax/ foldx, R0 is the baseline transcript levels in Eq. 1; A = Cmax·(1 − FB); B = Cmax·FB. A and B correspond respectively to a portion of Cmax that declines rapidly (at slope α) and more gradually (at slope β) at time Tmax.
Six random effects were included on the following parameters: Cmax, foldx, Tmax, FB, α, and β; all parameters were assumed to be log-normally distributed. For the residual error model, log-transformed data were modeled with an exponential error model (constant error model in log-space), which is typical for the qPCR assay.
Extended structural model with comedication effect on expansion
The impact of tocilizumab or corticosteroids on the expansion was simply included via two factors F1 and F2 corresponding to the effect of each comedication on the growth rate ρ. A factor being smaller than 1 indicates a decrease in expansion rate as a result of the comedication.
These factors are applied in the model following the times of administrations of each comedication T1 and T2 with these equations:

This is done in the mlxtran code by capturing the times of the first and second treatments, if they are given before Tmax, in the t1 and t2 variables, respectively, with the lines below, while t1 and t2 take the Tmax value if the corresponding treatment is given after that time:
if TOCI1T_reg<=STERSTT_reg
    t1=min(TOCI1T_reg,Tmax)
    F1=Ftoci
    t2=min(STERSTT_reg,Tmax)
    F2=Fster
else
    t1=min(STERSTT_reg,Tmax)
    F1=Fster
    t2=min(TOCI1T_reg,Tmax)
    F2=Ftoci
end
For all patients except one patient who had an allergic reaction, F1 = Ftoci (effect of tocilizumab) and F2 = Fster (effect of steroids). Although some patients received multiple doses of tocilizumab and corticosteroids, only the impact of the first dose was modeled.
The new constants R1 and R2 are given by and
The code for the full model is then:
DESCRIPTION:

[LONGITUDINAL]
input ={foldx, Tmax, Cmax, alpha, FB, beta, Ftoci, Fster, TOCI1T_reg, STERSTT_reg}
TOCI1T_reg = {use = regressor}
STERSTT_reg = {use = regressor}

EQUATION:

if TOCI1T_reg<=STERSTT_reg
	t1=min(TOCI1T_reg,Tmax)
    F1=Ftoci
    t2=min(STERSTT_reg,Tmax)
    F2=Fster
else
	t1=min(STERSTT_reg,Tmax)
    F1=Fster
    t2=min(TOCI1T_reg,Tmax)
    F2=Ftoci
end

rho=log(foldx)/Tmax
R0=Cmax/exp(rho*Tmax)
R1=R0*exp(rho*t1)
R2=R1*exp(F1*rho*(t2-t1))
CmaxAdjust = R2*exp(F1*F2*rho*(Tmax-t2))

A = (1-FB)* CmaxAdjust
B=FB*CmaxAdjust

if t<0
	ylin=R0
elseif t<t1
	ylin=R0*exp(rho*t)
elseif t<t2
	ylin = R1*exp(F1*rho*(t-t1))
elseif t<Tmax
	ylin=R2*exp(F1*F2*rho*(t-t2))
else
	ylin=A*exp(-alpha*(t-Tmax))+B*exp(-beta*(t-Tmax))
end
logy=log(ylin)


OUTPUT:
output = {logy}
Estimation of the models in Monolix
Base model
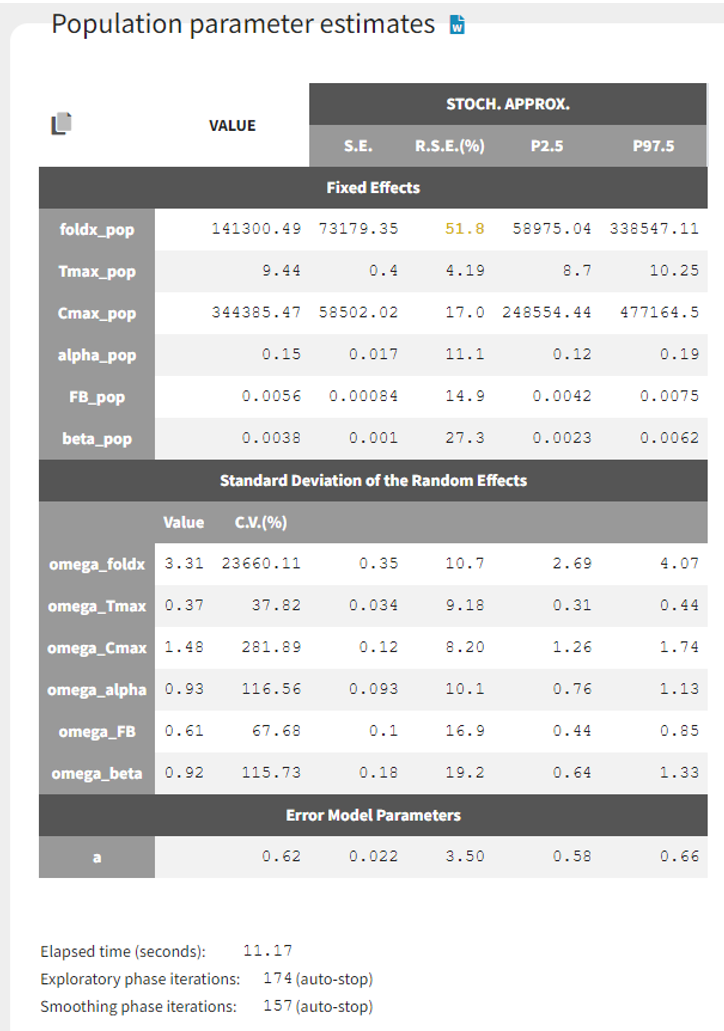
We estimate the population parameters of the base model with SAEM using its autostop criterion, and the standard errors with stochastic approximation.
The population estimates are estimated with good confidence, except foldx which has an RSE slightly larger than 50%.
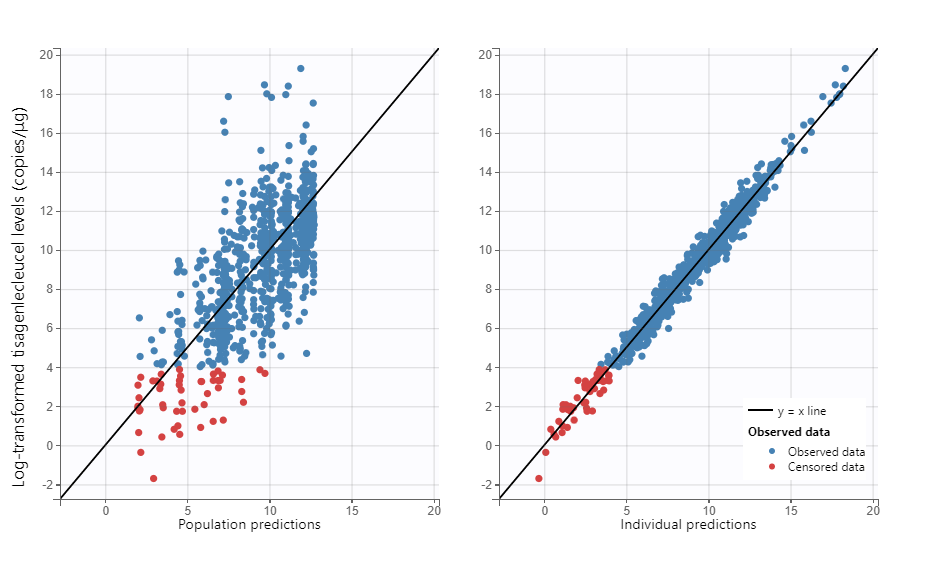
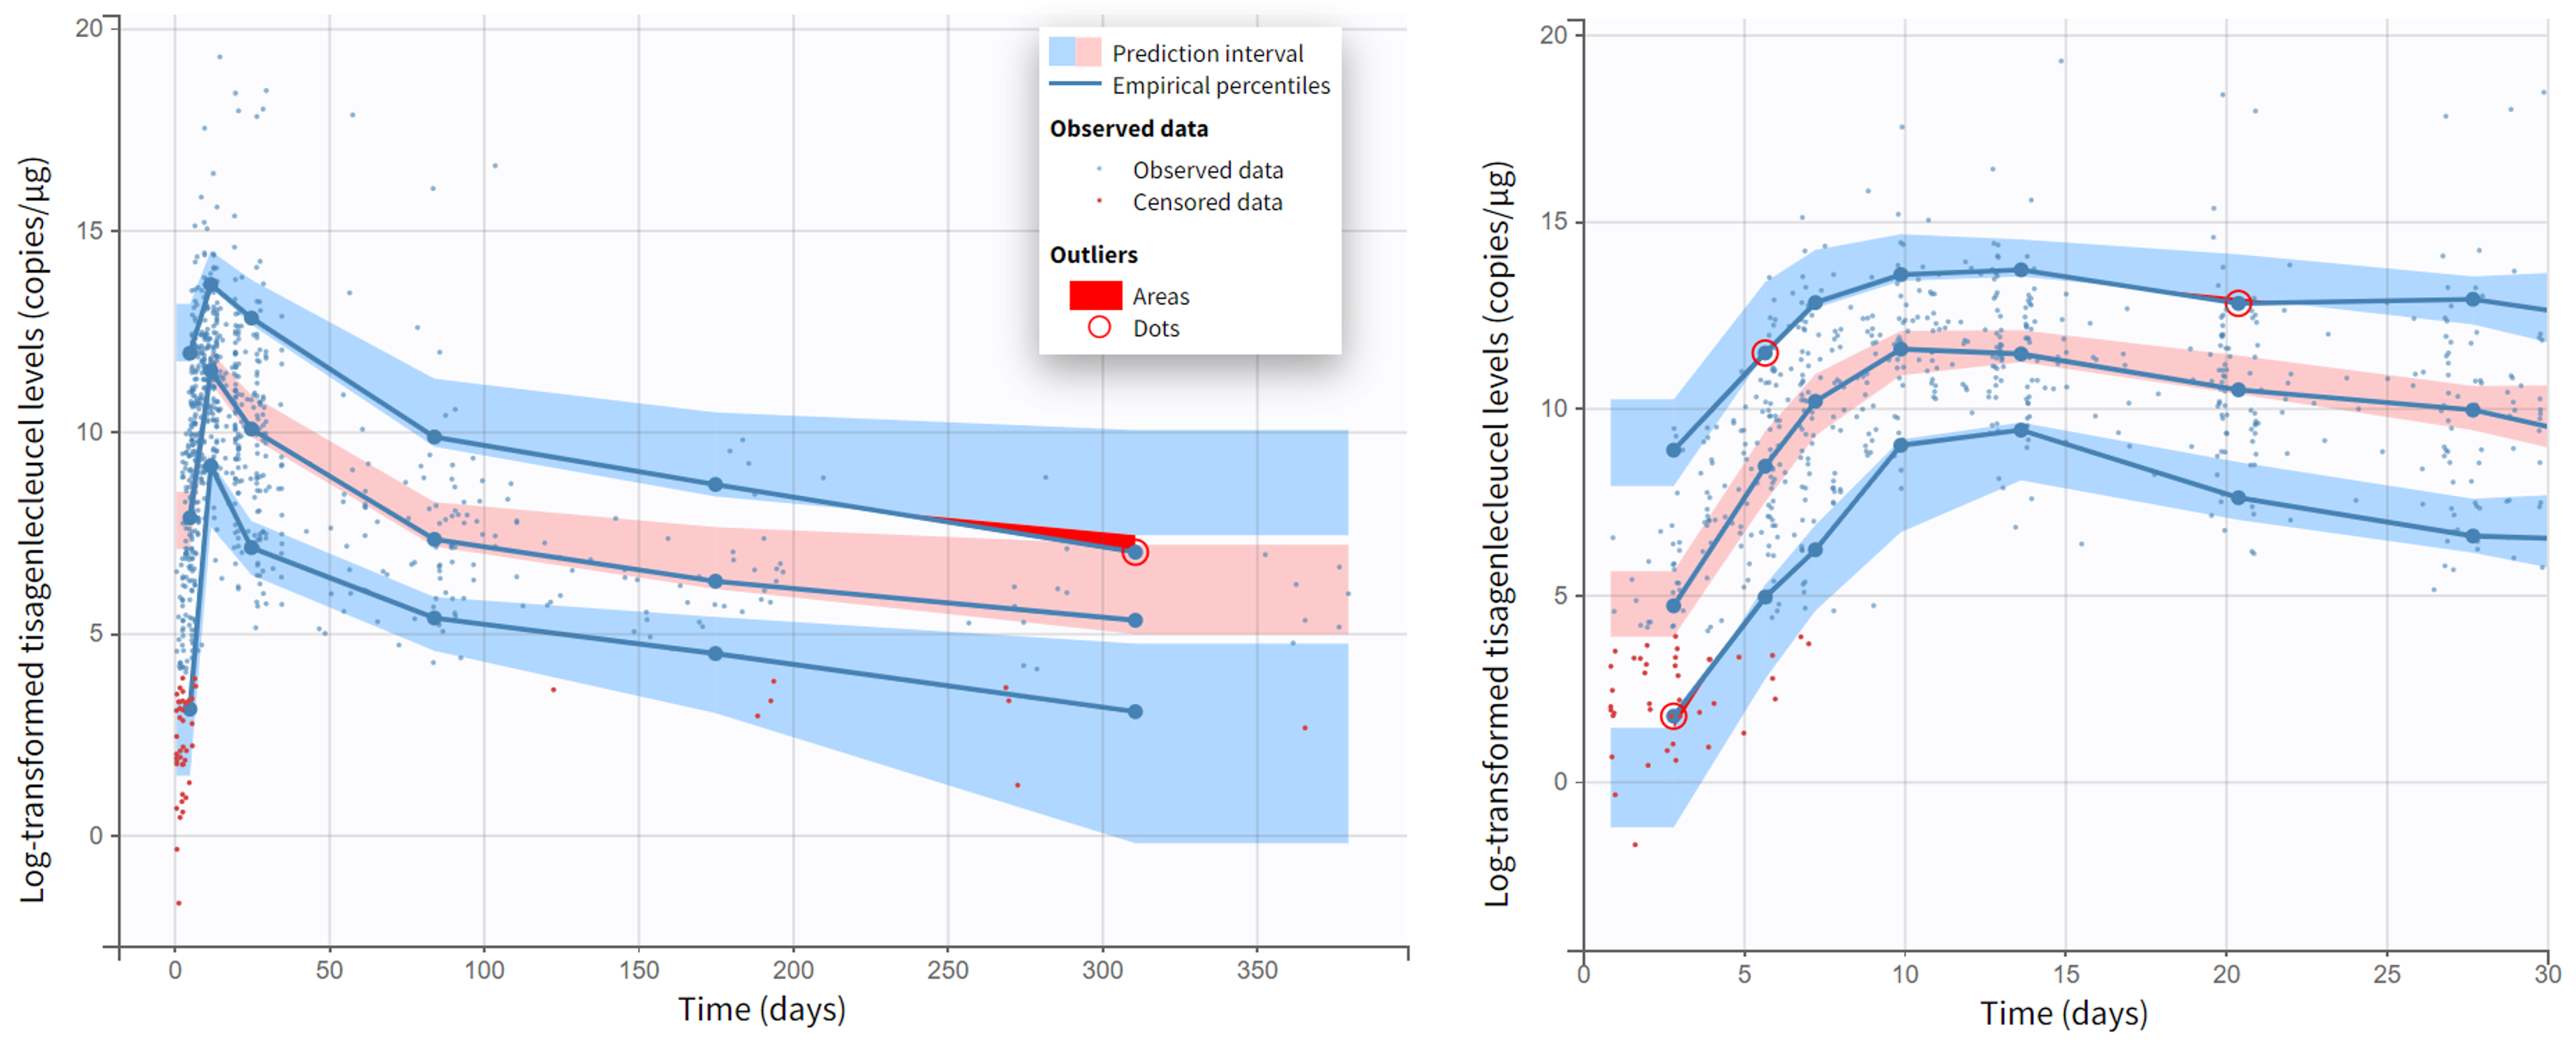
Moreover, diagnostic plots such as the Observations vs Predictions or the VPC show that the model captures well the data. Below we show the plots of Observations vs Population predictions and Individual predictions, the visual predictive check (VPC) over the full measurement period and a version of the VPC over the first 30 days, as well as individual fits for a set of representative individuals.

Representative individual profiles (subjects: 65, 66, 67, 3). Y-axis: Log-transformed tisagenlecleucel levels (copies/μg), X-axis: Time (days)
Covariate analysis
In the Statistical tests section of the Monolix results, we can assess correlations between the covariates and Cmax to check the impact of comedication on tisagenlecleucel expansion. Correlations with TOCI1T and STERSTT, which are the times of first comedication doses, are checked with Pearson's correlation test while correlations with TOCI1T_comed and STERSTT_comed which are the binary variables coding for comedication are assessed with ANOVA.
We see no p-value below 0.05, therefore comedication does not seem to have a significant effect on tisagenlecleucel expansion.
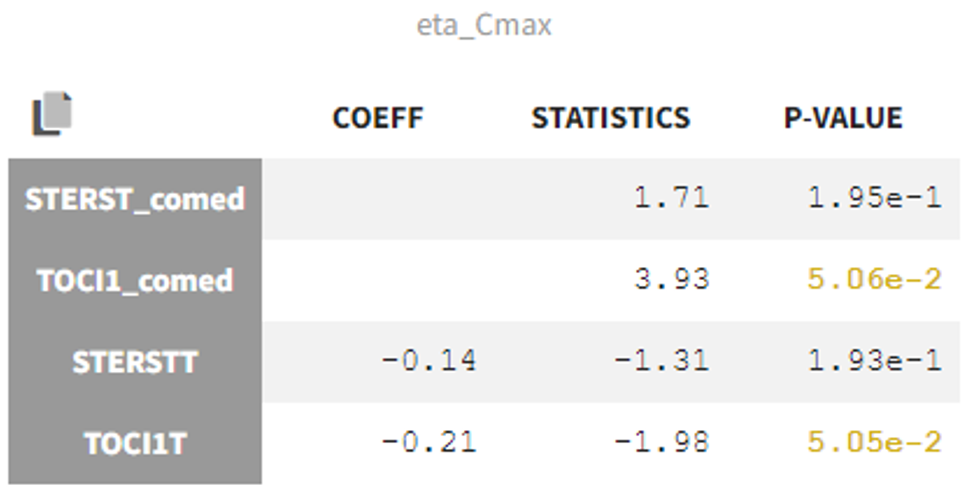
Correlations with other random effects are also associated with p-values lower than 0.05.
Extended model with comedication effect on expansion
The model is then extended to include comedication effect with two new parameters Ftoci and Fster, without random effects.
After running SAEM, the estimates for Ftoci and Fster are estimated to 1.24 and 0.97 respectively, so both close to 1, indicating a low or no impact on the rate of expansion. In fact, the 95% confidence interval reported in Monolix2024R1 for Fster includes 1.
VALUE | STOCH. APPROX | |||||
S.E. | R.S.E.(%) | P2.5 | P97.5 | |||
Fixed Effects | ||||||
foldx_pop | 72502.64 | 35752.81 | 49.3 | 31262.67 | 168144.03 | |
Tmax_pop | 9.26 | 0.39 | 4.19 | 8.53 | 10.06 | |
Cmax_pop | 229600.52 | 35774.25 | 15.6 | 170082.22 | 309946.56 | |
alpha_pop | 0.15 | 0.015 | 10.4 | 0.12 | 0.18 | |
FB_pop | 0.0066 | 0.00099 | 14.8 | 0.005 | 0.0089 | |
beta_pop | 0.0049 | 0.0011 | 22.9 | 0.0032 | 0.0075 | |
Ftoci_pop | 1.24 | 0.055 | 4.43 | 1.14 | 1.35 | |
Fster_pop | 0.97 | 0.056 | 5.72 | 0.87 | 1.09 | |
Standard Deviation of the Random Effects | ||||||
Value | C.V.(%) | |||||
omega_foldx | 3.15 | 14404.85 | 0.37 | 11.9 | 2.5 | 3.97 |
omega_Tmax | 0.37 | 38.11 | 0.032 | 8.65 | 0.31 | 0.44 |
omega_Cmax | 1.3 | 209.61 | 0.11 | 8.49 | 1.1 | 1.53 |
omega_alpha | 0.86 | 104.7 | 0.082 | 9.51 | 0.71 | 1.04 |
omega_FB | 0.73 | 84.29 | 0.13 | 17.4 | 0.52 | 1.02 |
omega_beta | 0.64 | 70.53 | 0.17 | 27.4 | 0.38 | 1.06 |
Error Model Parameters | ||||||
a | 0.62 | 0.021 | 3.42 | 0.58 | 0.66 | |
It is noteworthy that very few individuals have rich enough data to estimate several expansion slopes, with several samples available after and before their first treatment time in the expansion phase, and this may explain that it is difficult to estimate any significant impact of the comedication on the expansion.
We show below the individual fits during the first 3 weeks for two such subjects, with the values of TOCI1T and STERSTT overlaid on the plots (this is possible by checking the “Information” toggle on that plot in Monolix):
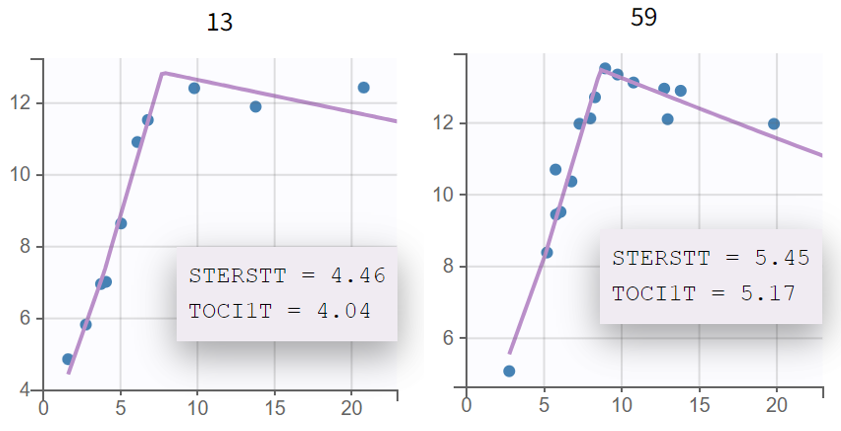
(x-axis: Time in days, y-axis: log of tisagenlecleucel transgene copies/ug)
For these two subjects as for the other ones, the rates of expansion (slope of qPCR curve) before and after tocilizumab or corticosteroids appear similar. In addition, no notable difference compared to the base model can be seen either in other diagnostics plots such as Observations vs Predictions of the VPC.
Nonetheless, this new model results in a decrease of 20 points in BICc compared to the base model, which indicates a slightly better fit.
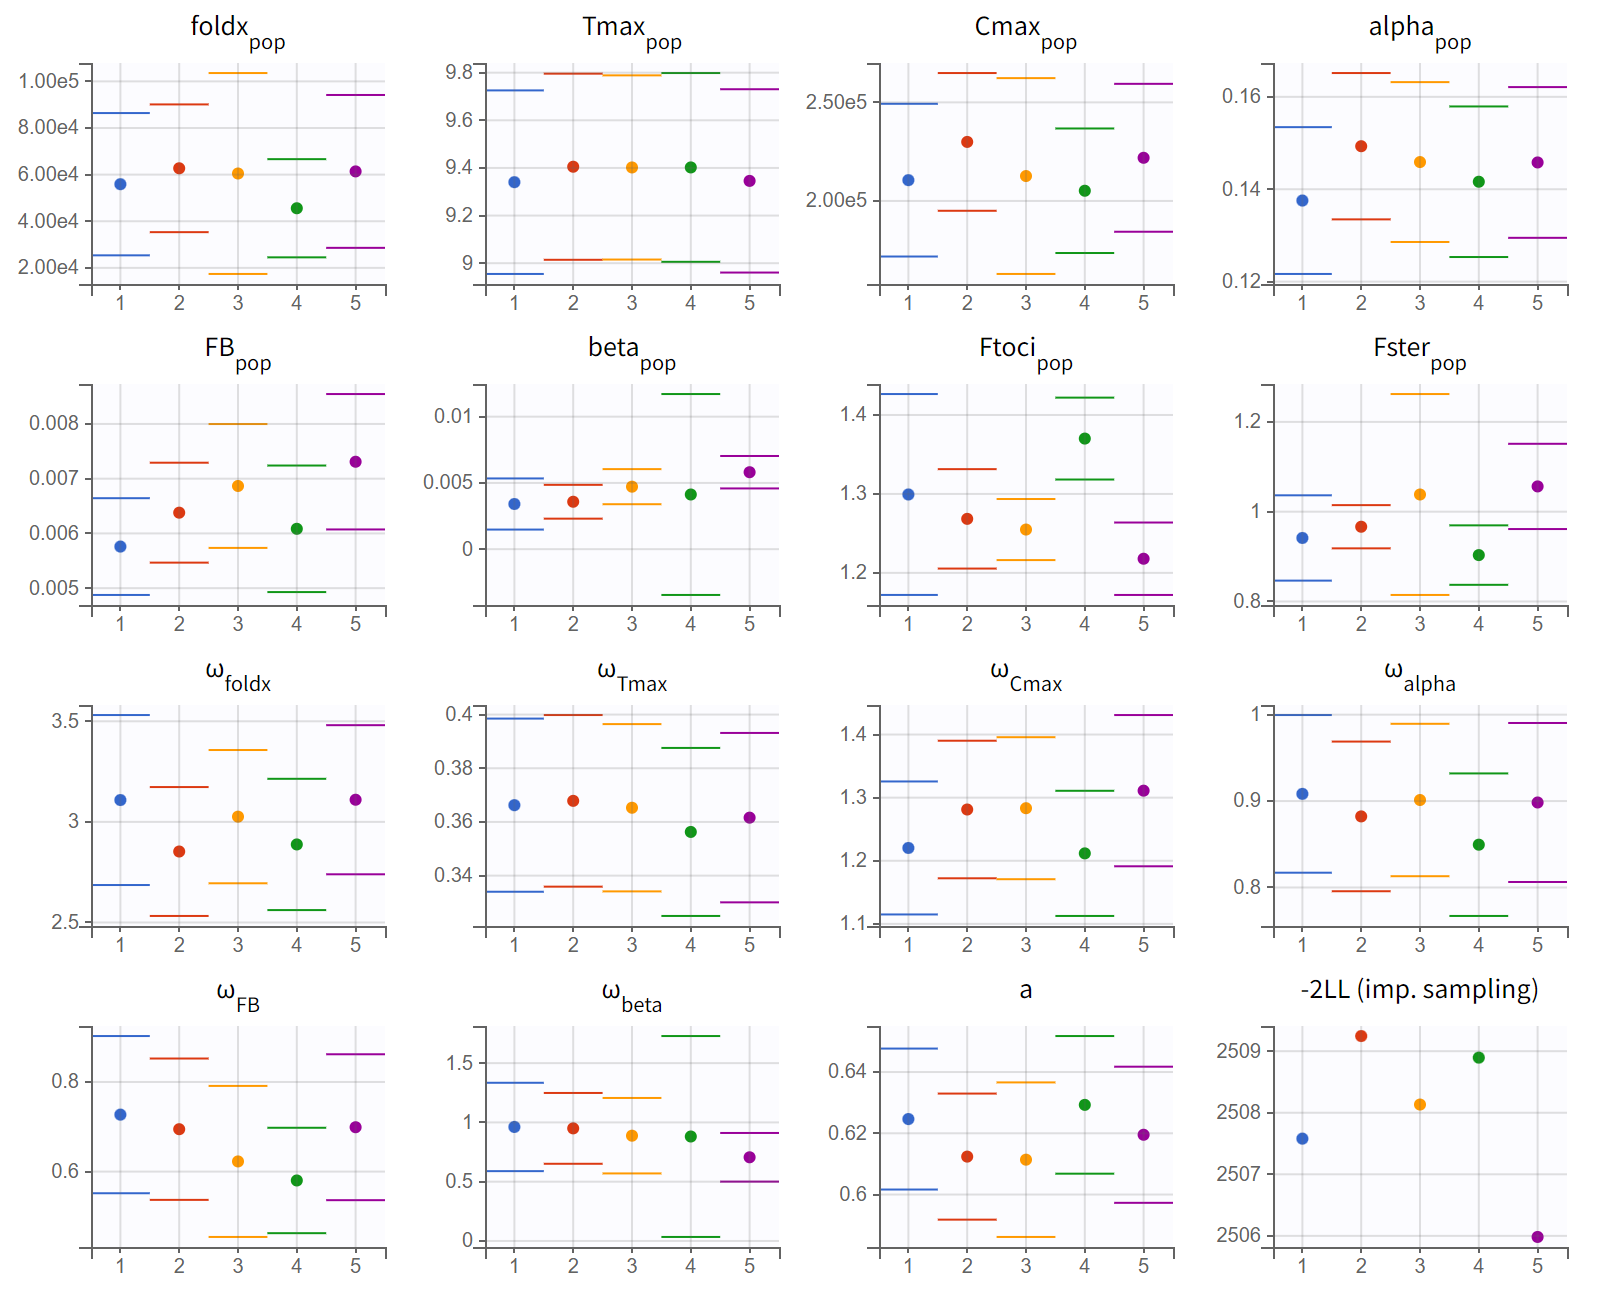
To check the robustness of the parameter and objective function value estimation, we run multiple estimation replicates starting from slightly different initial values with the convergence assessment tool of Monolix. The resulting plots show that the estimates are quite reliably estimated across the 5 runs, with a maximal difference of 3 points in -2LL:
Conclusion
The mixed-effect cellular kinetic model used in this case study characterized well the expansion and persistence of tisagenlecleucel and may be used to describe other types of genetically modified cells across multiple disease indications.
It demonstrates the value of population PK models in predicting the behavior of CAR T-cells in vivo. These models are instrumental in enhancing our understanding of CAR T-cell therapy dynamics and can guide the development of more effective treatment protocols.
