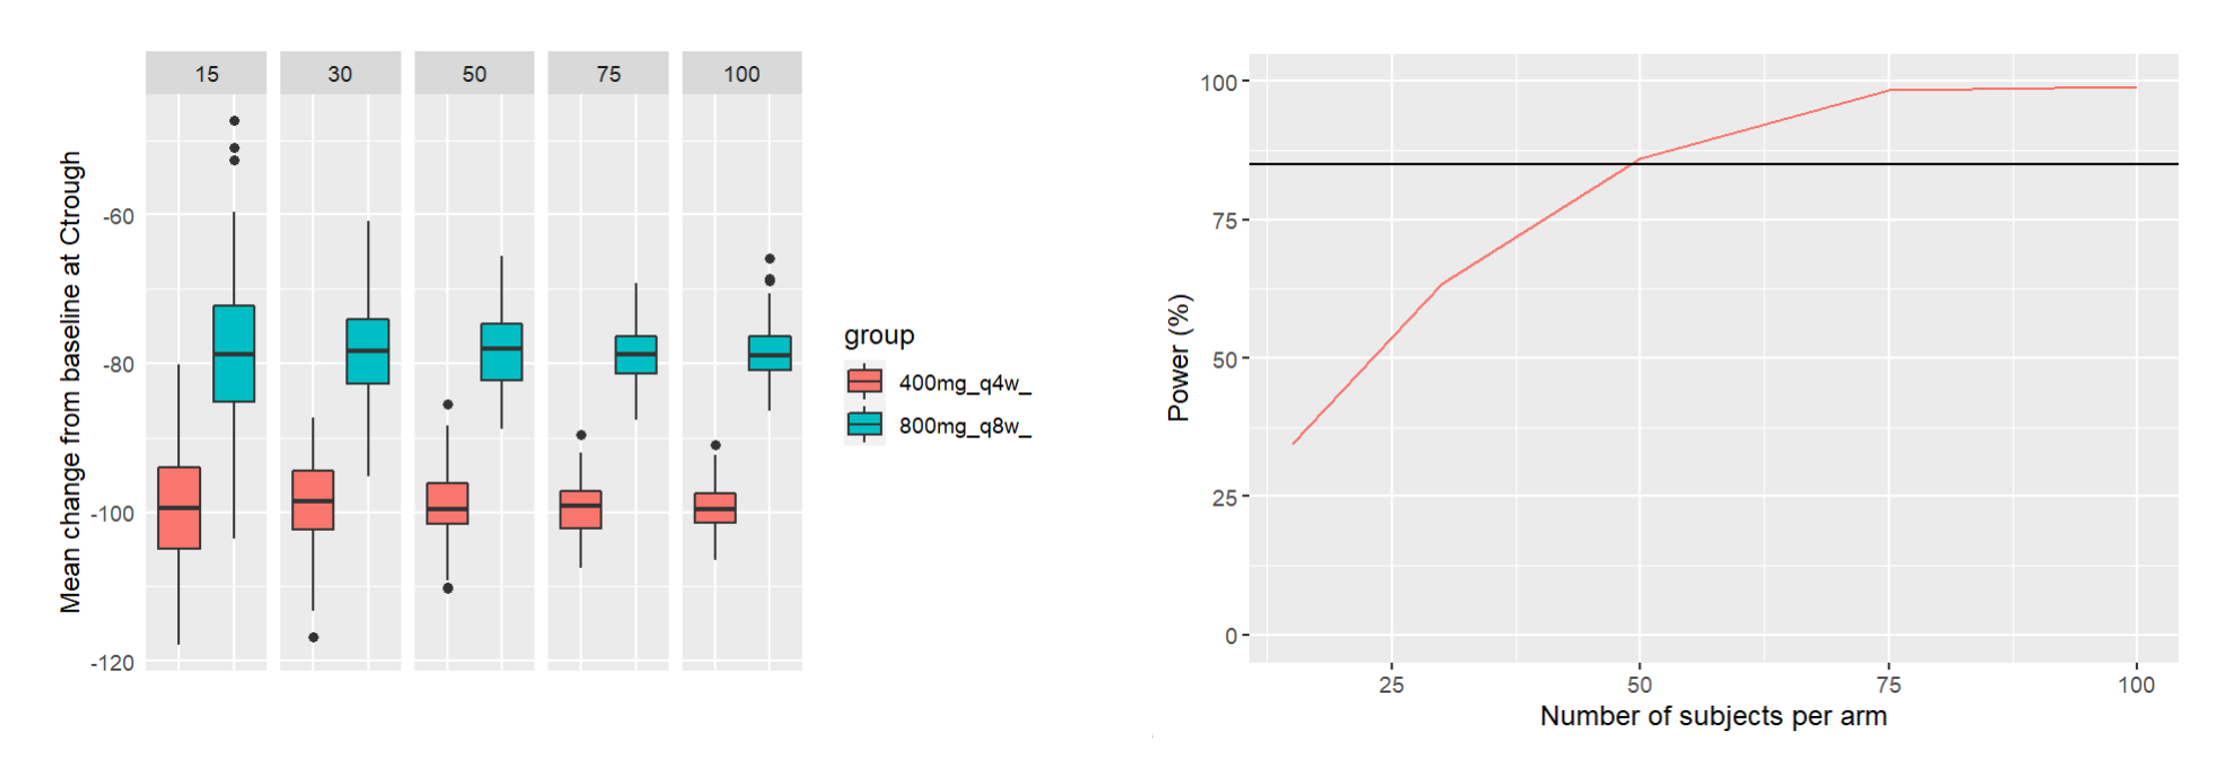
This piece of code uses the demo project OutcomeEndpoint_PKPD_changeFromBaseline.smlx (demo folder 6.1), with the goal of comparing two treatment arms (400mg Q4W and 800mg Q8W) with a range of different sample sizes (number of simulated individuals per arm). The power of the clinical trial is defined as the chance of having a significant difference in the mean change from baseline between the two arms. This chance is computed over 200 replicates for each sample size. The script then plots the power of the clinical trial with respect to the sample size, with a target power of 85% displayed as a horizontal line.
Note that Simulx versions prior to 2023 did not provide connectors to define the outcomes and endpoints like in the interface.
library(ggplot2)

#initialize LixoftConnectors with Simulx
library(lixoftConnectors)
initializeLixoftConnectors(software="simulx")

# load Simulx demo project comparing 3 treatment arms
project <- paste0(getDemoPath(), "/6.outcome_endpoints/6.1.outcome_endpoints/OutcomeEndpoint_PKPD_changeFromBaseline.smlx")
loadProject(projectFile = project)

# check the groups defined in the project.
getGroups()

# We are interested comparing the two groups 400mg_q4w_ and 800mg_q8w_ for the output "Cholesterol_measured_atCtrough"
# -> remove other groups and outputs
removeGroup("400mg_q8w_")
removeGroupElement("400mg_q4w_", "Cholesterol_prediction")
removeGroupElement("800mg_q8w_", "Cholesterol_prediction")
removeGroupElement("400mg_q4w_", "mAbTotal_prediction")
removeGroupElement("800mg_q8w_", "mAbTotal_prediction")

# check the endpoints defined in the project. We are interested in the endpoint mean_changeFromBaseline
getEndpoints()
deleteEndpoint("percentChangeFromBaseline")


#enable group comparison since it is disabled in the demo project
setGroupComparisonSettings(referenceGroup = "400mg_q4w_",enable = TRUE)


# gather endpoints for trials of several sample sizes
Nrep <- 200
sample_sizes <- c(15, 30, 50, 75, 100)
PowerDF = data.frame(sampleSize=sample_sizes,Power=rep(0,length(sample_sizes)))


meanChFromBL <-NULL
for(indexN in 1:length(sample_sizes)){

  N <- sample_sizes[indexN]
  # change the number of individuals for each arm
  setGroupSize("400mg_q4w_", N)
  setGroupSize("800mg_q8w_", N)
  setNbReplicates(Nrep)

  # run the simulation and endpoints
  runScenario()

  # optional - gathering endpoints to plot them for each group and sample size
  meanChFromBL_N <- getEndpointsResults()$endpoints$mean_changeFromBaseline
  meanChFromBL <- rbind(meanChFromBL, cbind(meanChFromBL_N, sampleSize=N))

  # gathering success for each replicate
  successForAllRep <- as.logical(getEndpointsResults()$groupComparison$mean_changeFromBaseline$success)
  PowerDF$Power[indexN]=sum(successForAllRep)/Nrep*100

}

# to plot the results (no connectors available yet for Simulx plots)

library(ggplot2)

ggplot(meanChFromBL, aes(group, arithmeticMean)) +
        geom_boxplot(aes(fill = group)) +
        facet_grid(. ~ sampleSize) +
        ylab("Mean change from baseline at Ctrough")+
        xlab("")+
        theme(axis.text.x = element_blank(), axis.ticks = element_blank())

ggplot(PowerDF)+geom_line(aes(x=sampleSize,y=Power, color="red"))+
  ylab("Power (%)")+xlab("Number of subjects per arm")+geom_hline(yintercept = 85)+
  ylim(c(0,100))+ theme(legend.position = "none")