plotMCMC
[Monolix] Plot MCMC convergence
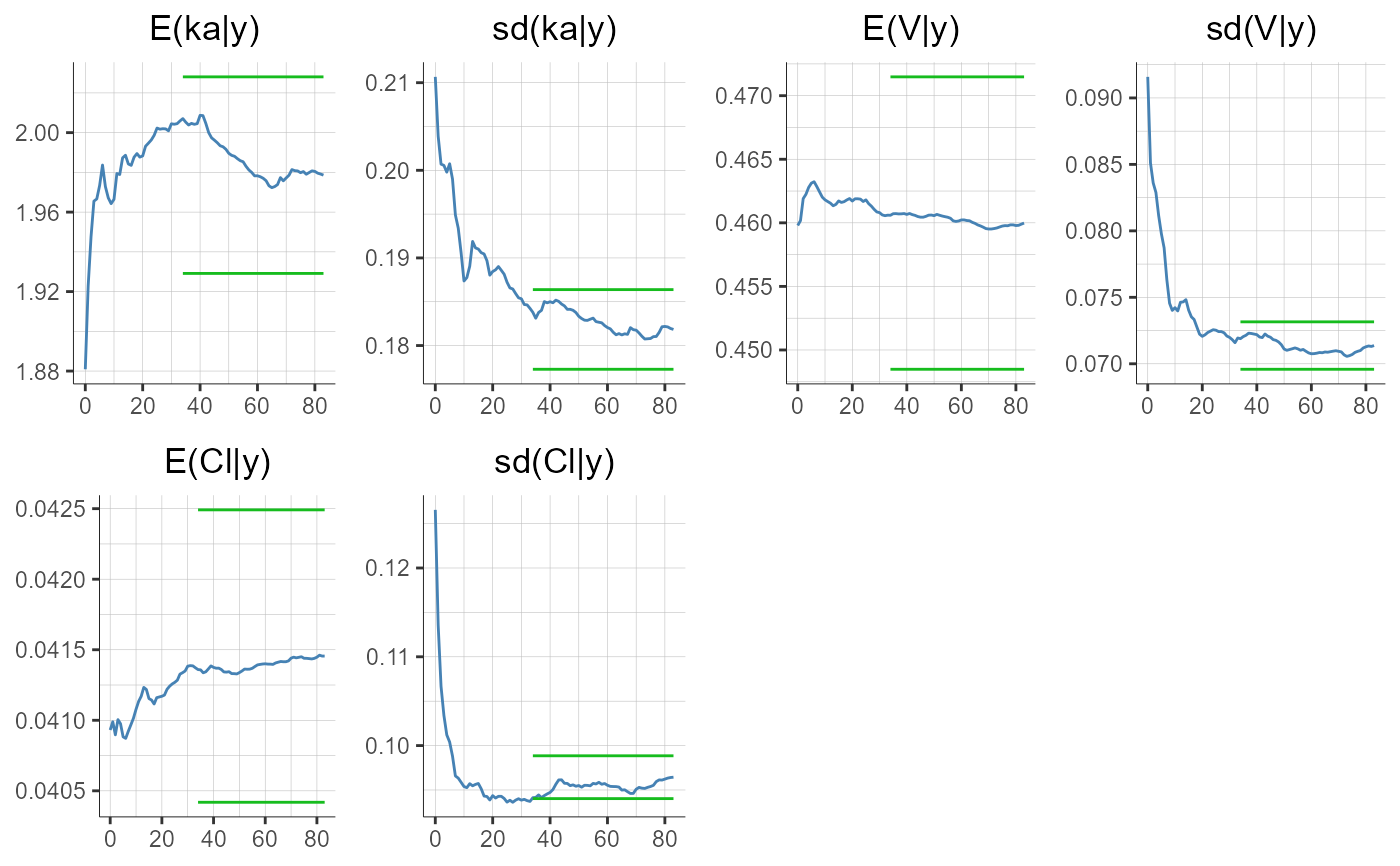
Plot iterations and convergence for the conditional distribution task.
Usage
R
plotMCMC(settings = list())Arguments
- settings
a list of optional settings:
grid(logical) add (TRUE) / remove (FALSE) plot grid (default TRUE).ncol(integer) number of columns when facet = TRUE (default 4).fontsize(integer) Plot text font size.
Value
A TableGrob object if multiple plots (output of grid.arrange)
Examples
R
  initializeLixoftConnectors(software = "monolix")
  project <- file.path(getDemoPath(), "1.creating_and_using_models",
                       "1.1.libraries_of_models", "theophylline_project.mlxtran")
  loadProject(project)

  runPopulationParameterEstimation()
  runConditionalDistributionSampling()

  plotMCMC()

R
#> TableGrob (1 x 1) "arrange": 1 grobs
#>   z     cells    name            grob
#> 1 1 (1-1,1-1) arrange gtable[arrange]
