
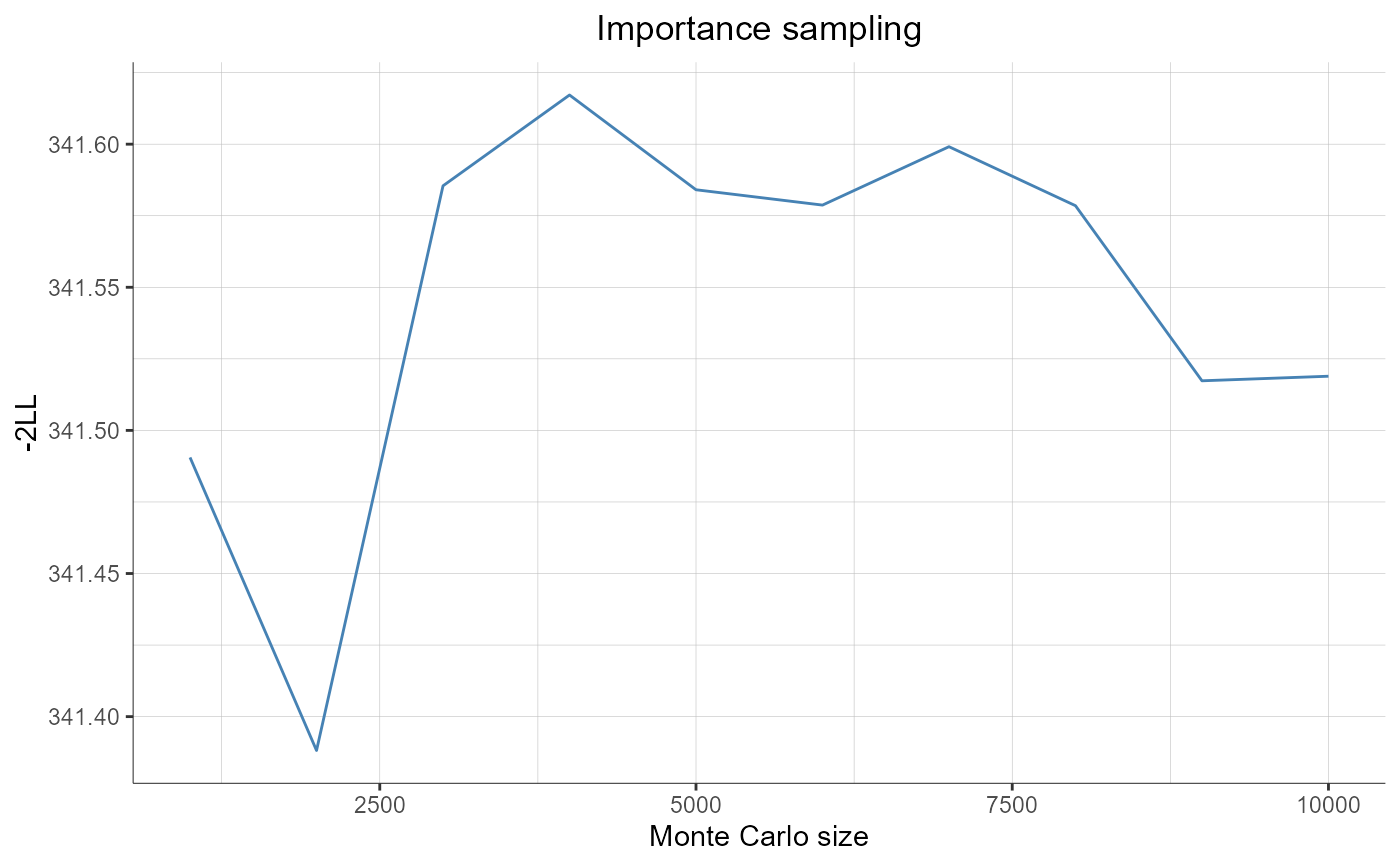
[Monolix] Plot Importance sampling convergence.
Plot iterations of the likelihood estimation by importance sampling.
Usage
R
plotImportanceSampling(settings = list())
Arguments
settings a list of optional settings:grid (logical) add (TRUE) / remove (FALSE) plot grid (default TRUE). fontsize (integer) Plot text font size.
Value
A ggplot object
Examples
R
  initializeLixoftConnectors(software = "monolix")
  project <- file.path(getDemoPath(), "1.creating_and_using_models",
                       "1.1.libraries_of_models", "theophylline_project.mlxtran")
  loadProject(project)

  runPopulationParameterEstimation()
  runLogLikelihoodEstimation()

  plotImportanceSampling()
R