Here are steps to check manually that applications are well installed on your computer. To run a numerical validation of the applications via an executable, please check Applications Validation.
Datxplore
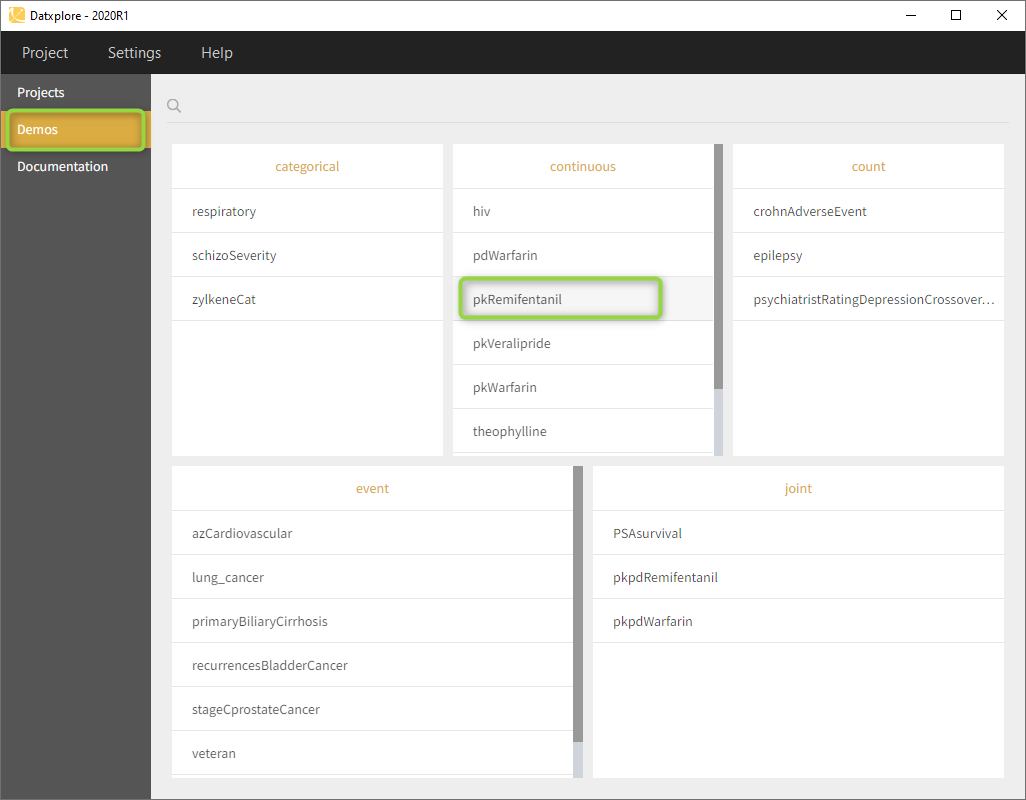
1. Open Datxplore
2. Go to the Demos (on the left) and choose project_covariates in 1.basic examples
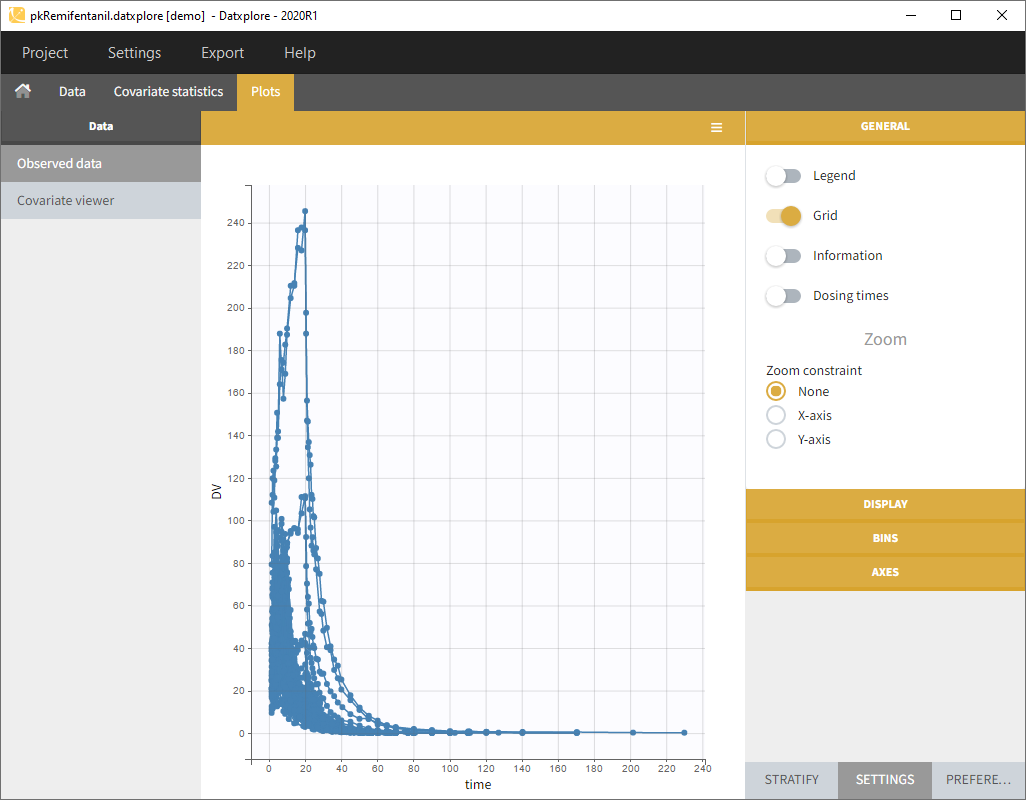
3. Datxplore should load the project and display the observed data plot
PKanalix
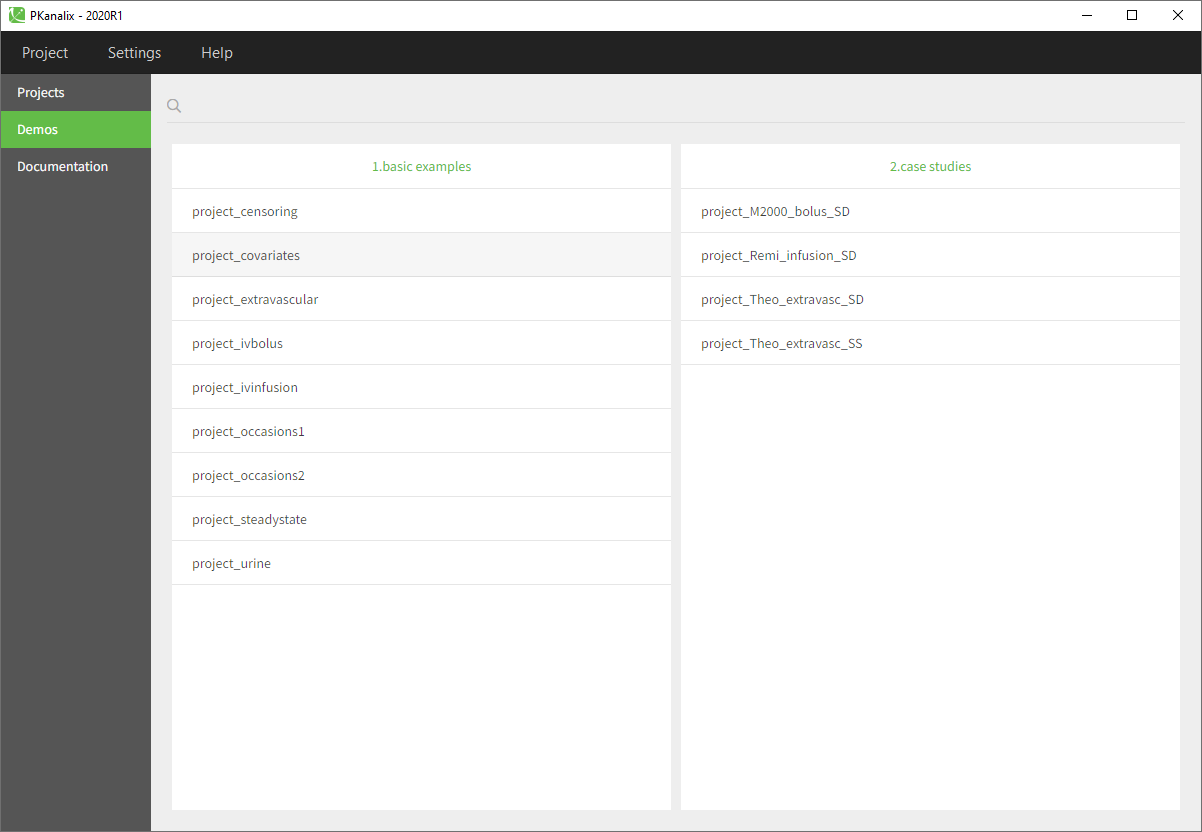
1. Open PKanalix
2. Go to the Demos (on the left) and choose project_covariates in 1.basic examples
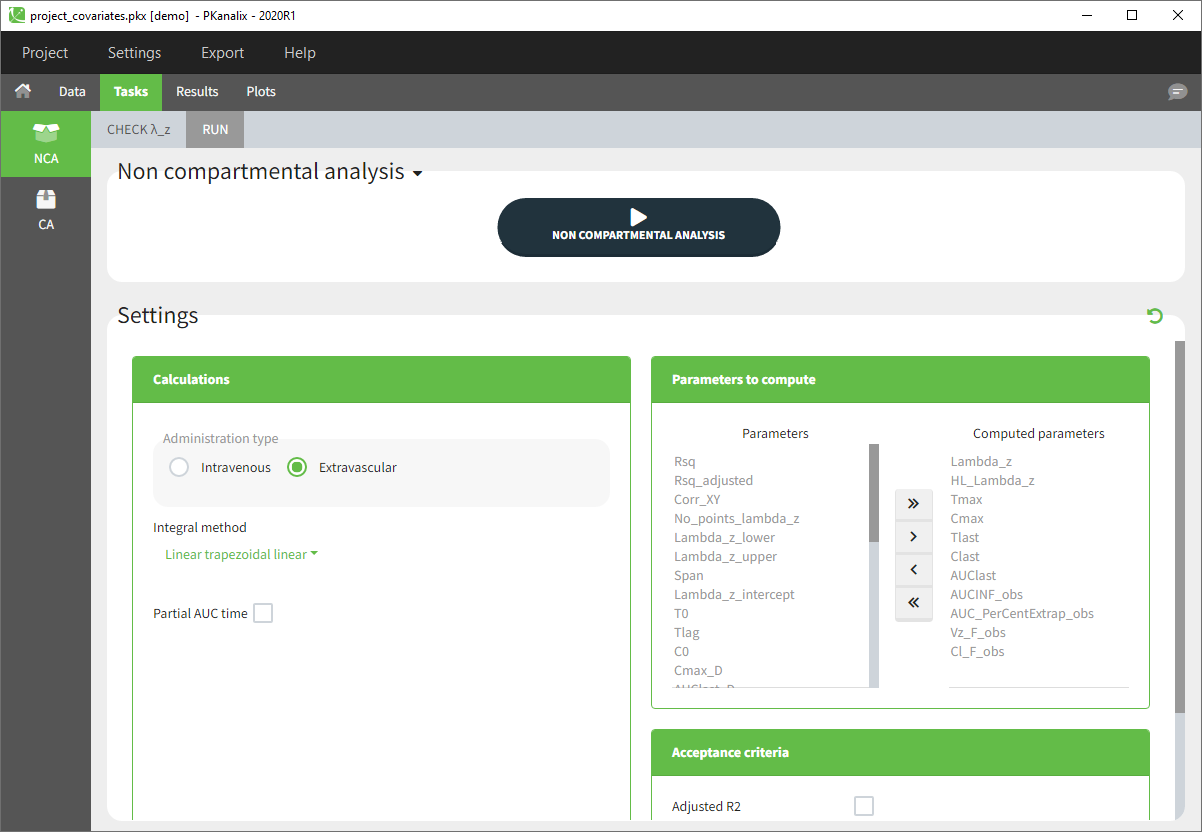
3. The Tasks, Results and Plots tabs appear. By default, you are on the Tasks>NCA tab. Click on the button “NON COMPARTMENTAL ANALYSIS” to perform the calculation.
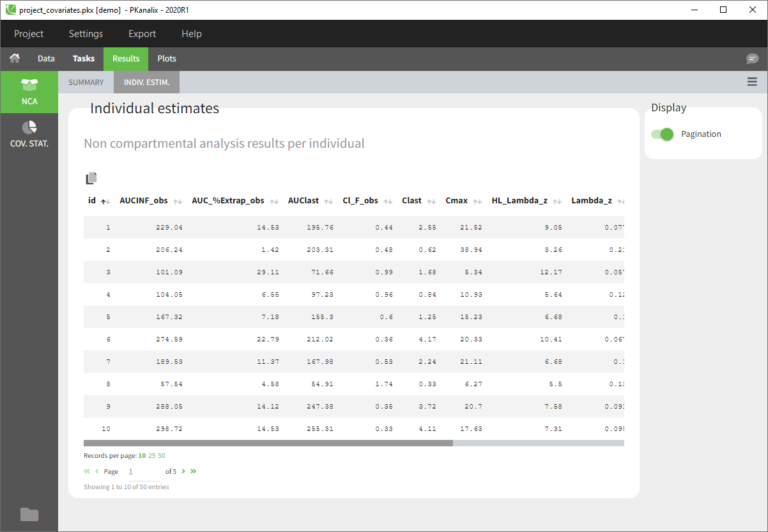
4. After the calculation, you are redirected to Results>NCA>Indiv.Estim corresponding to the individual estimates of the NCA parameters.
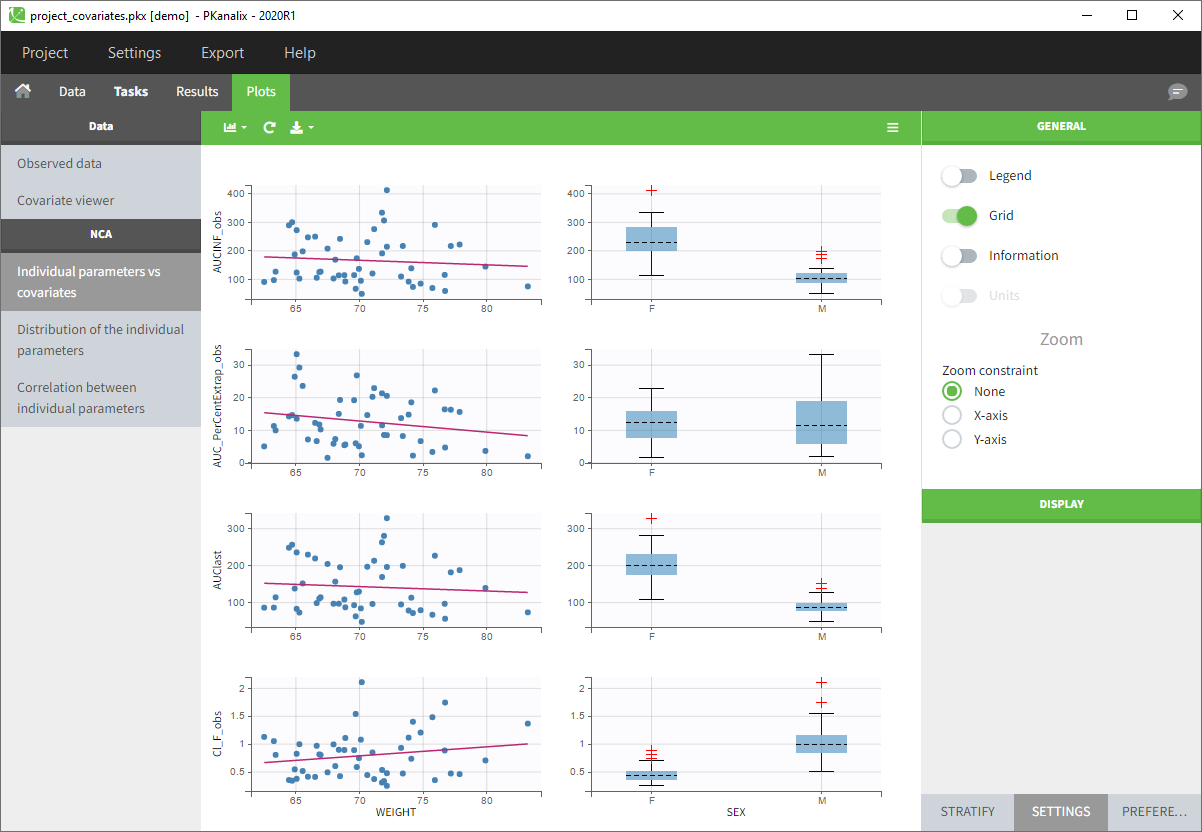
5. You can now click on Plots and by default you’ll see the Individual NCA parameters with respect to the covariates.
Monolix
1. Open Monolix
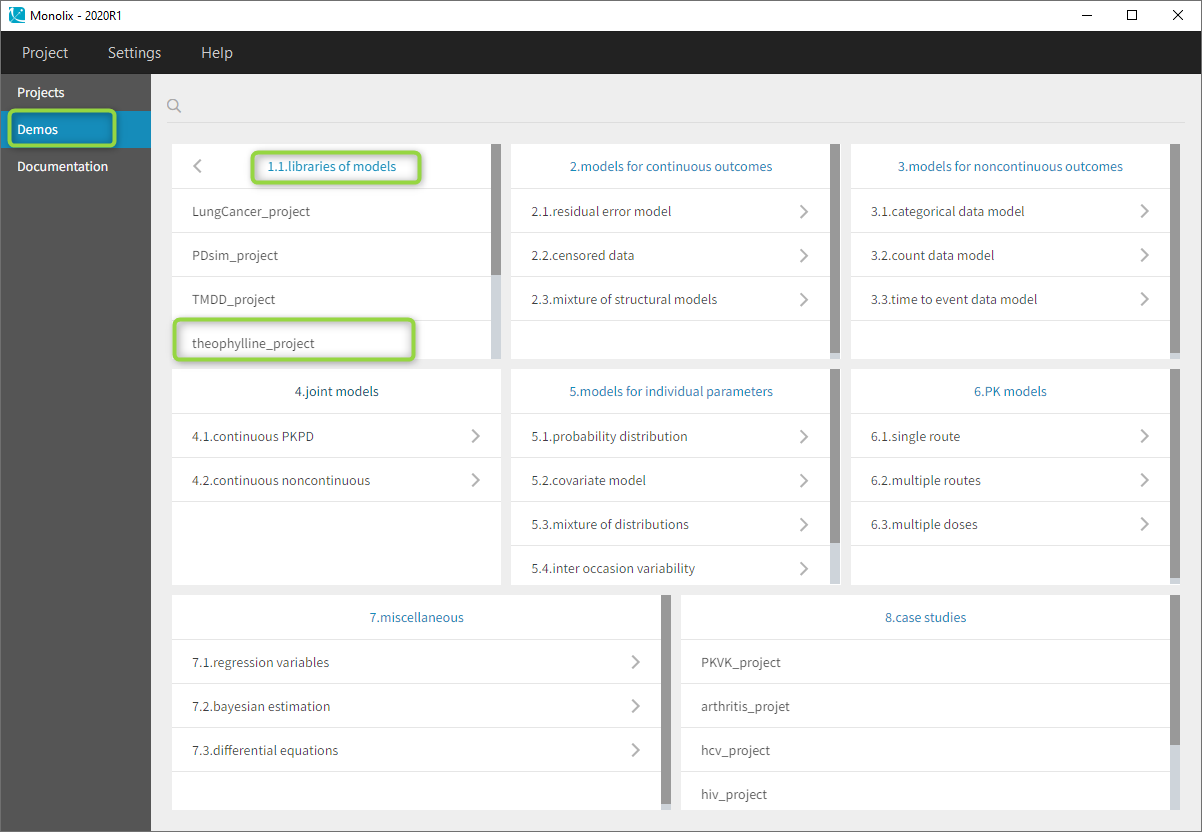
2. Go to the menu Demos and choose theophylline_project in section 1.1 libraries of models
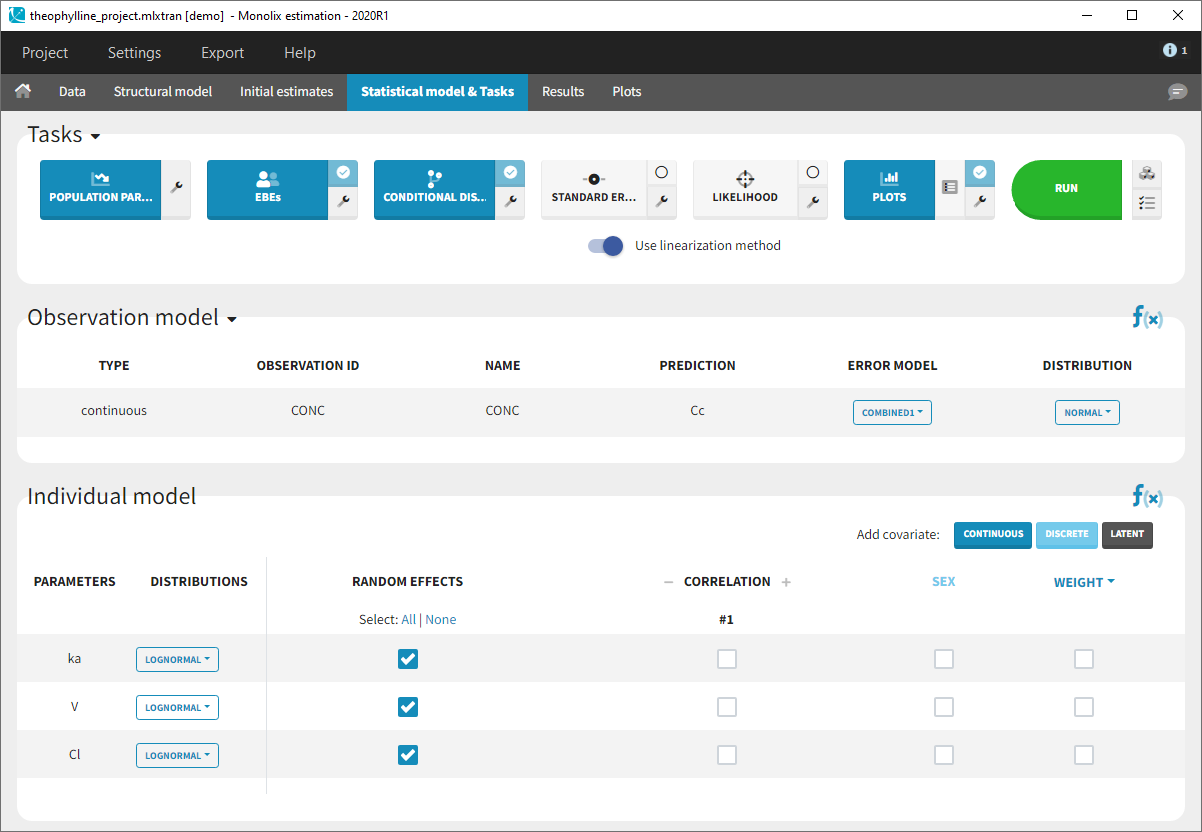
3. Monolix loads the project and the interface looks like this
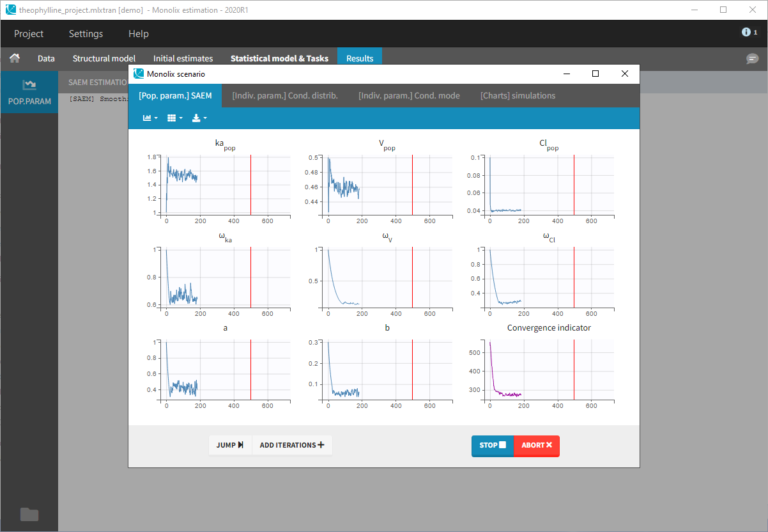
4. Clicking on the “Run” button launches the scenario as above
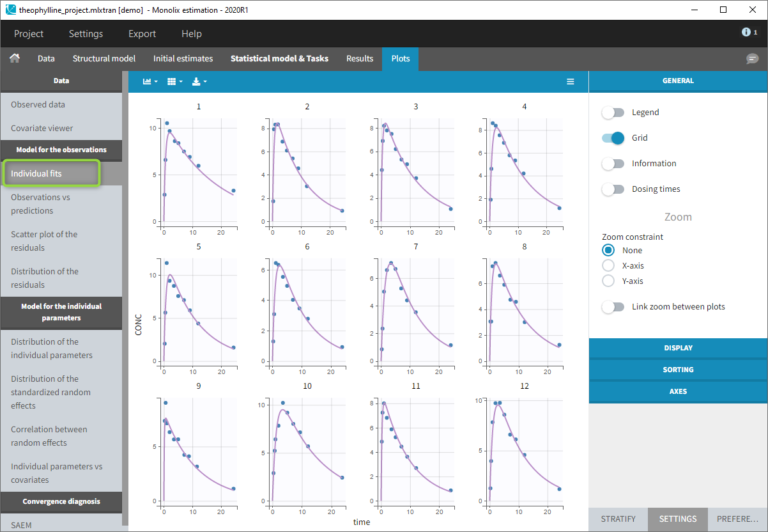
5. Close the scenario using the close button and the graphics are displayed behind on the Individual fits plot
Simulx
1. Open Simulx
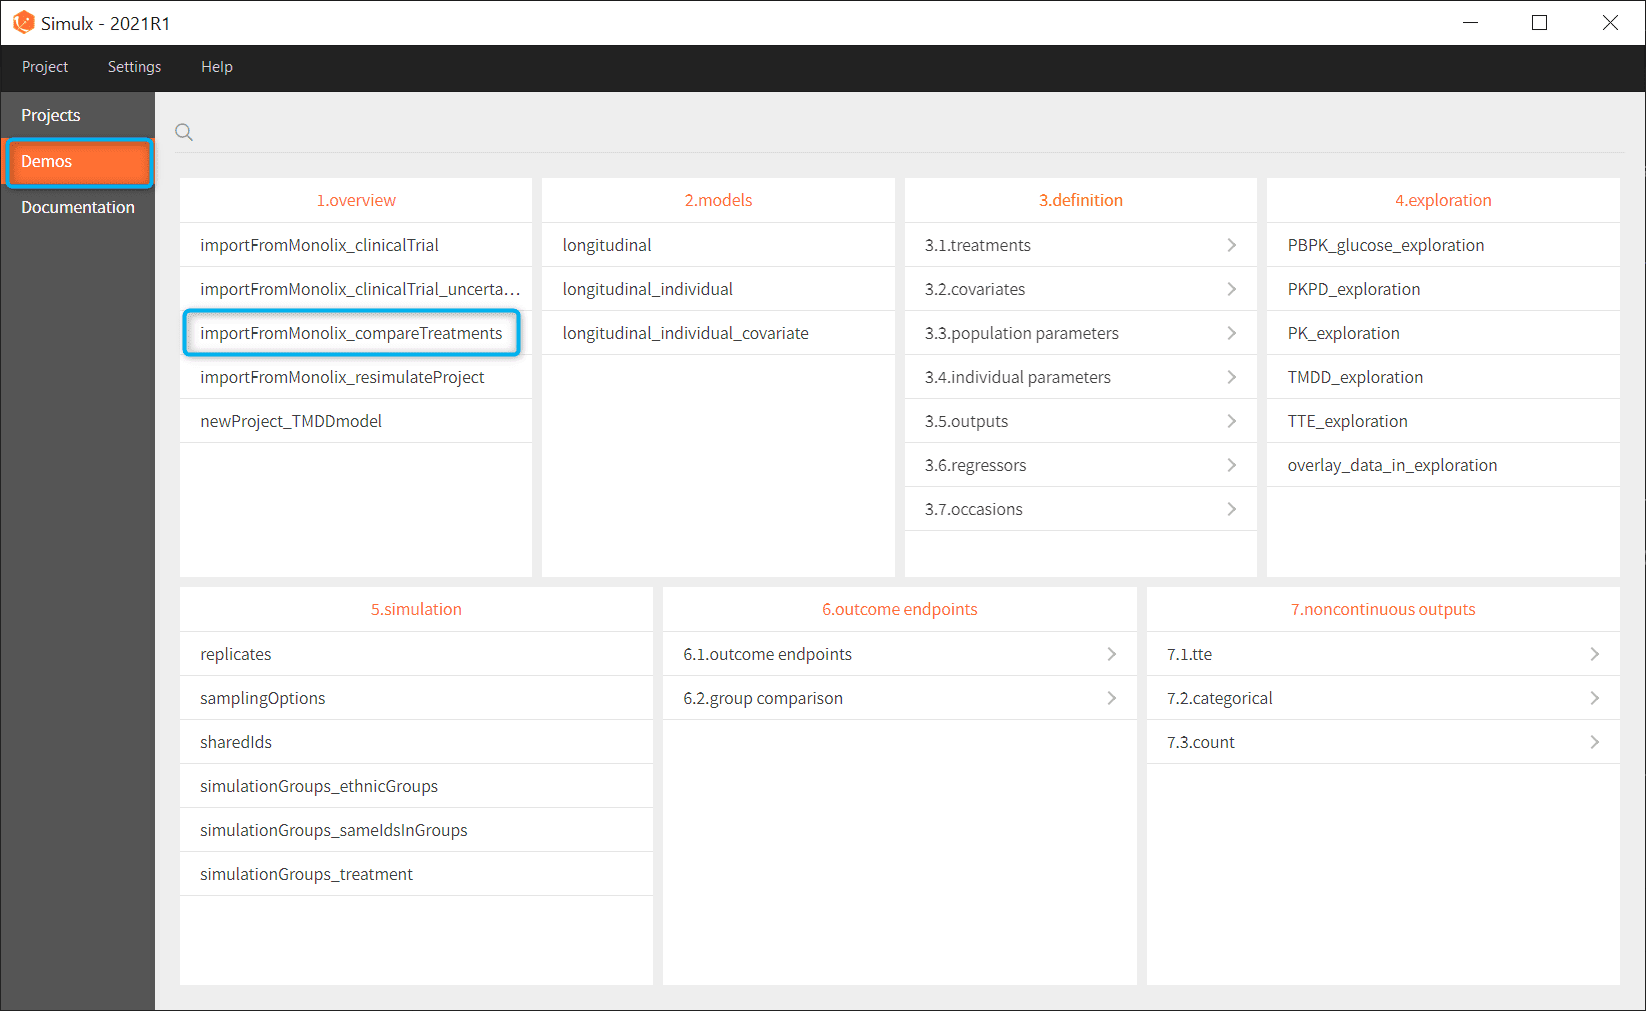
2. Go to the menu Demos and choose importFromMonnolix_compareTreatments in section 1.overview
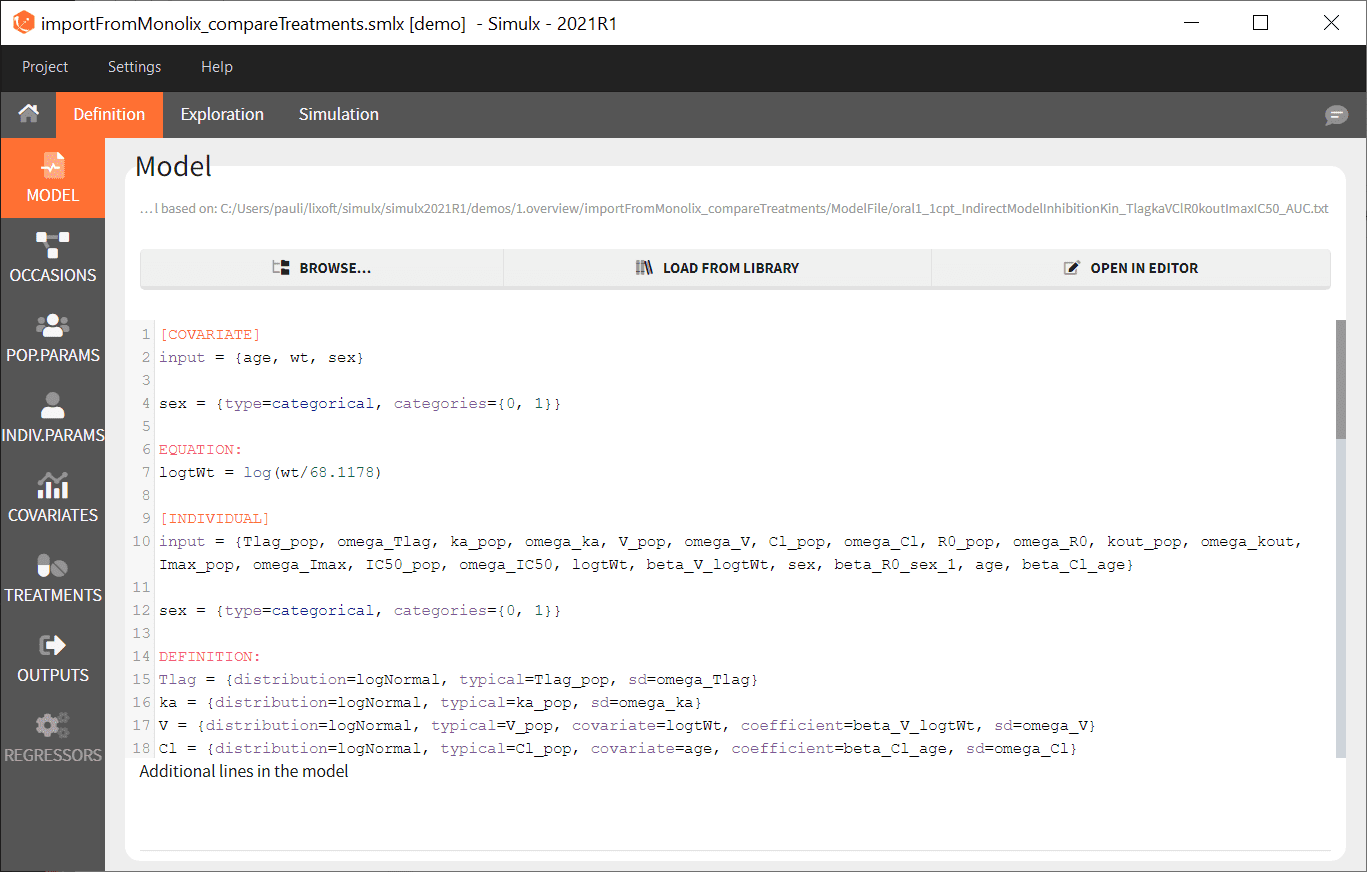
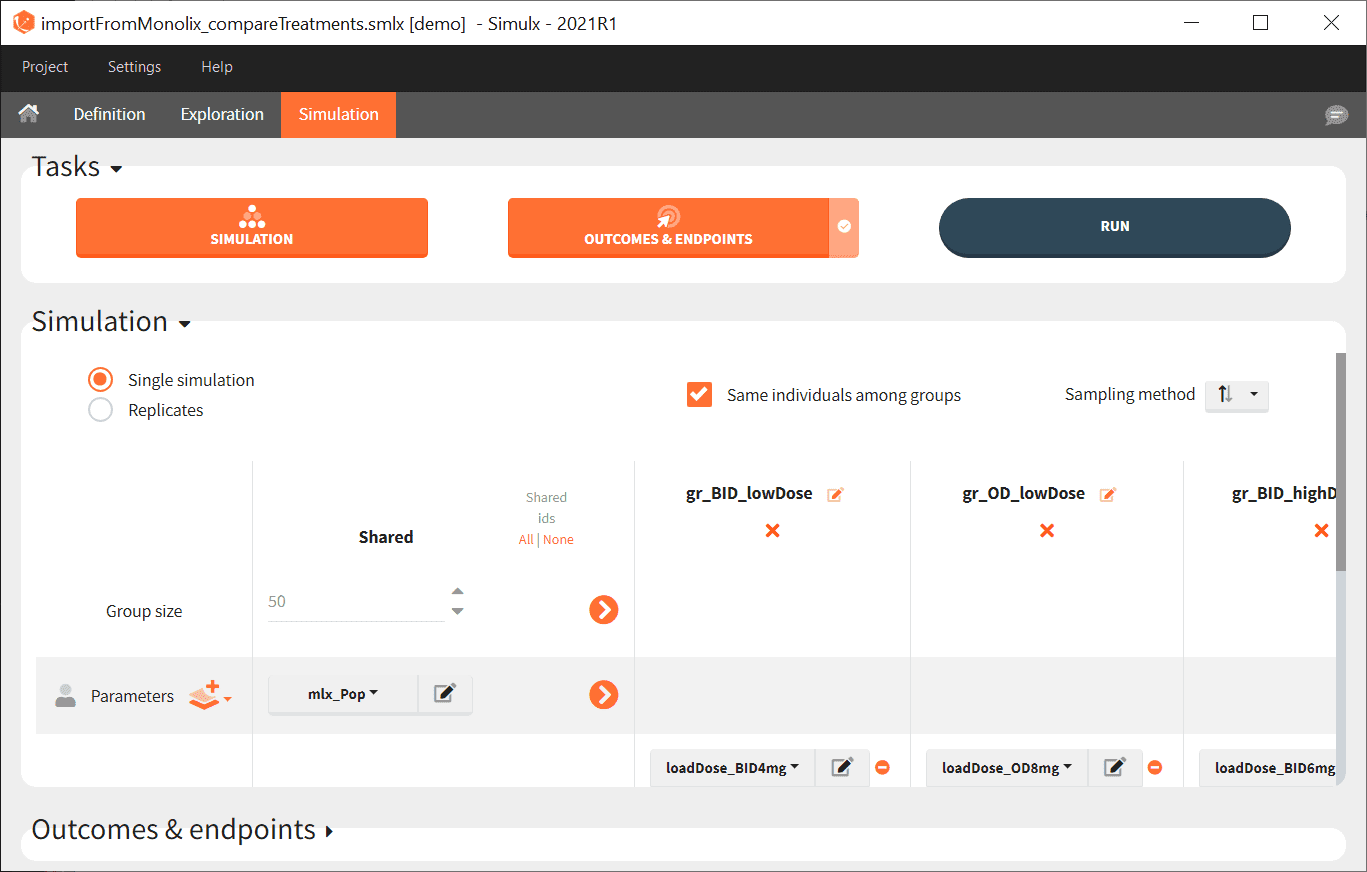
3. Simulx loads the project and the interface looks like the following figure
4. Go on the Simulation tab where the simulation is defined as shown here and click on RUN
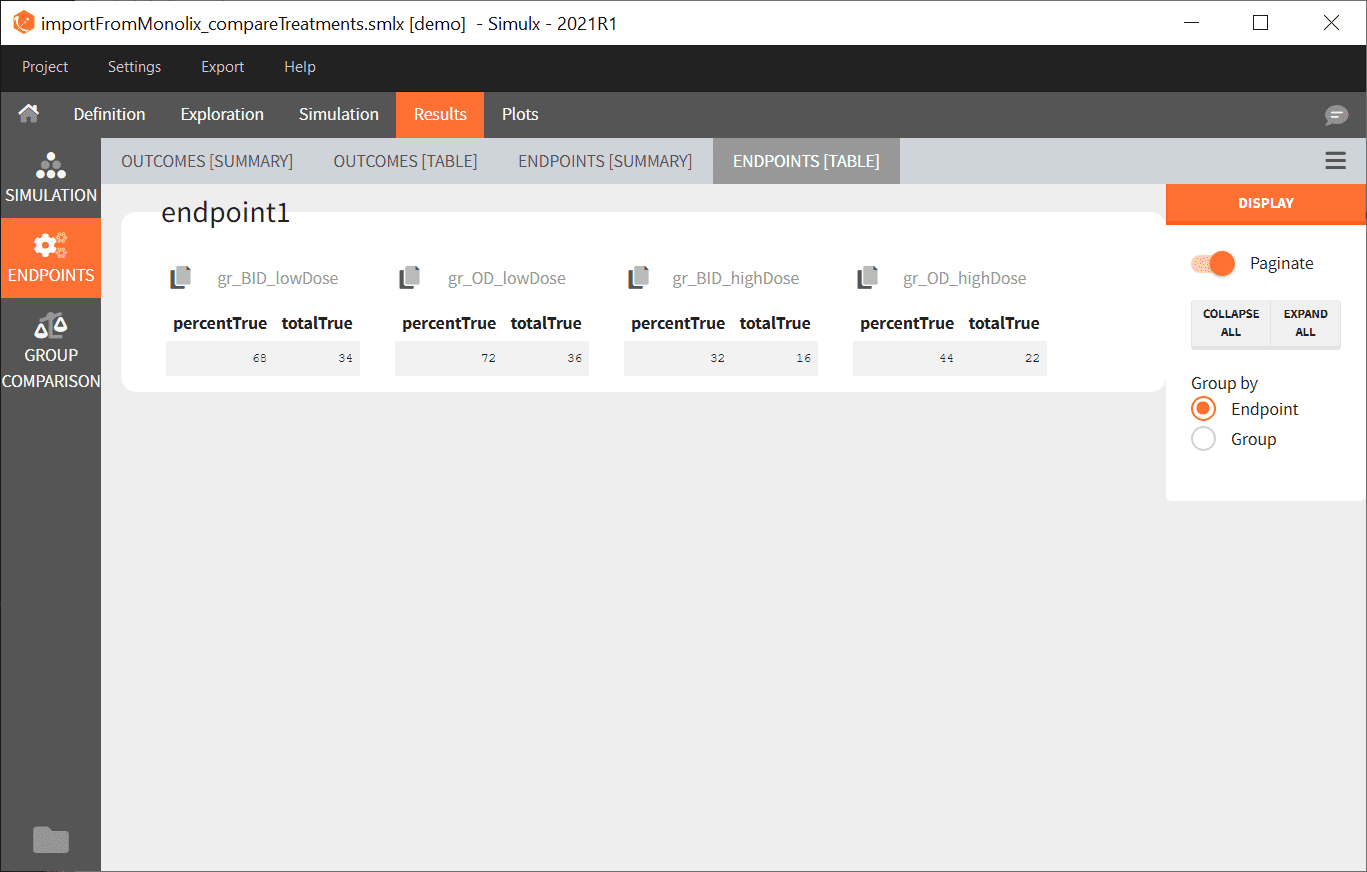
5. The numerical results of the simulations are then displayed
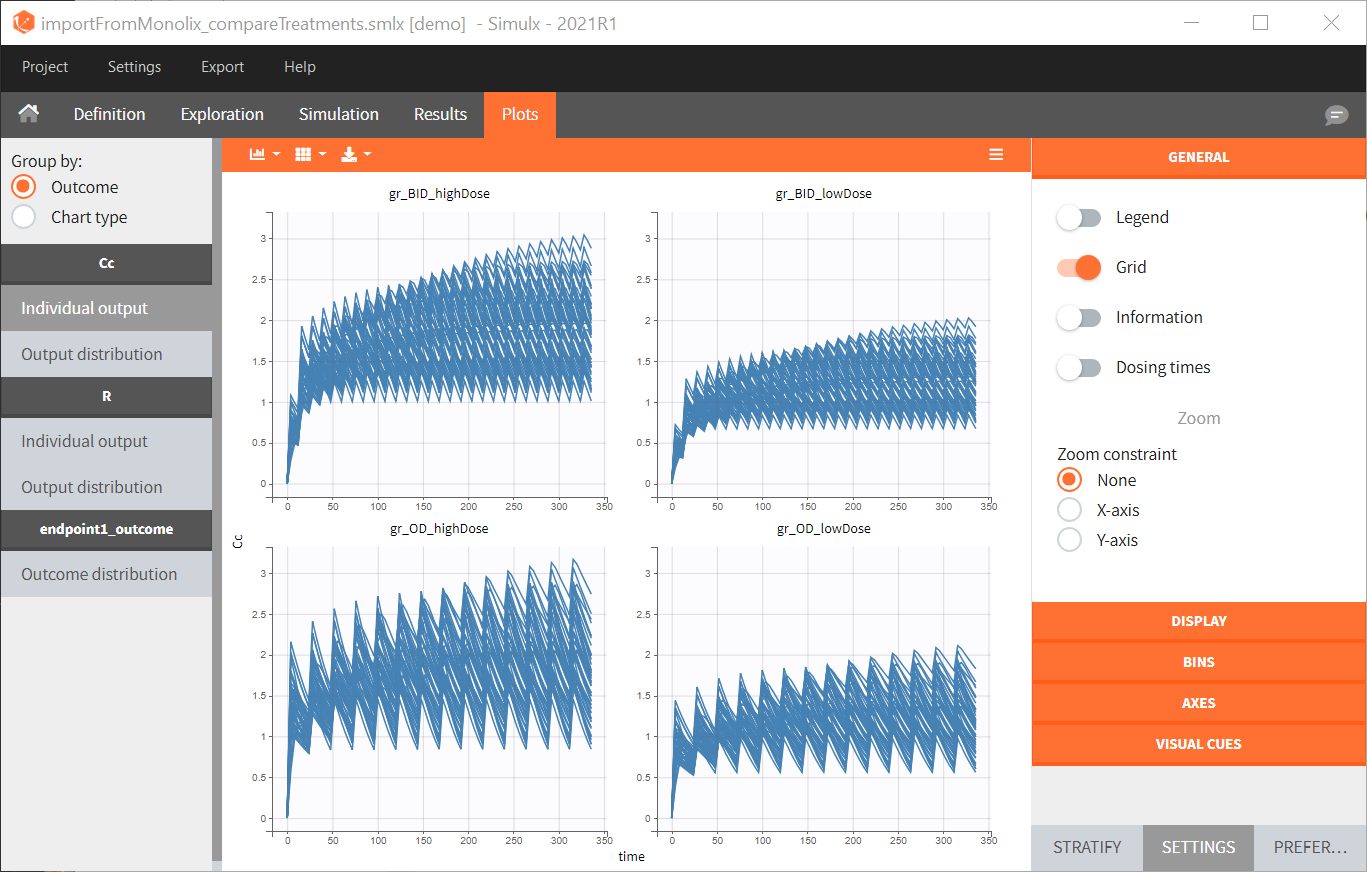
6. By clicking on the Plots tab, you can see the numerical results as here.